- Home
- Users & Science
- Scientific Documentation
- ESRF Highlights
- ESRF Highlights 2004
- Soft Condensed Matter
- Local Nanostructure of Single Carbon Fibres during Bending Deformation
Local Nanostructure of Single Carbon Fibres during Bending Deformation
Carbon fibres are especially suited for light-weight constructions in technical applications due to their low density (1.5 - 2.1 g/cm3), the extremely high values of tensile strength (3 - 5 GPa) and Young's modulus (up to 900 GPa) and the outstanding high-temperature behaviour, superior to any other material. The fibres are very small (around 10 micrometres in diameter) and their structure and its development during the application of high loads as required in technical use is still largely unknown.
 |
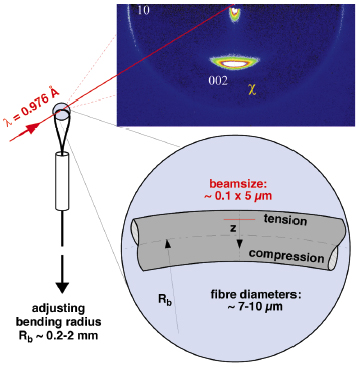
Fig. 59: Experimental setup: Bending is achieved by forming carbon fibre loops where the radius of the loop can be varied. The fibre is scanned by the X-ray beam from the waveguide structure with 100 nm lateral position resolution. 2D diffraction patterns were taken with a MAR-CCD detector. |
Single fibre bending experiments were designed to allow simultaneously scanning across the fibre from the tension to the compression range. Figure 59 shows the experimental setup: Increased bending is achieved by decreasing the bending radius of the fibre, pulling its ends through a thin hollow needle. Quantitative strain distribution across the fibres was achieved by measuring the bending radius (with an online light microscope) and the fibre diameter (with SEM). Scanning X-ray microdiffraction experiments were performed by using the microbeam emanating from the waveguide structure available at ID13 with a lateral resolution of 100 nm in one dimension [1]. The position dependence of two structural parameters under high load conditions are shown in Figure 60: The 10-band in the direction of the fibre axis yields the in-plane displacement d10 of the atoms in the hexagonal lattice planes of the graphene sheets, and thus the tensile strain at the level of the nanocrystallites. The second parameter is given by the azimuthal spread of the 002-reflection, its width ![]() 002 being the most important parameter for the preferred orientation of the graphene sheets and thus the Young's modulus of the fibres.
002 being the most important parameter for the preferred orientation of the graphene sheets and thus the Young's modulus of the fibres.
 |
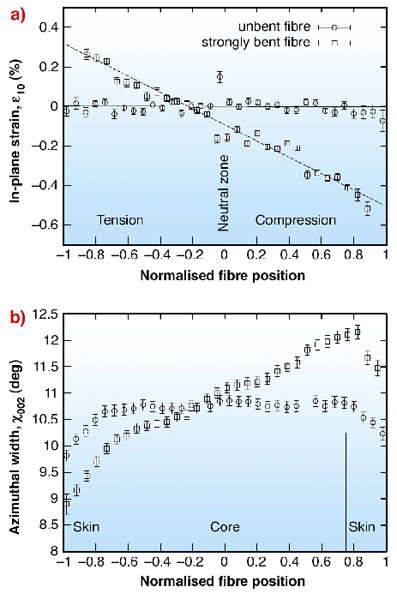
Fig. 60: (a) In-plane strain |
Figure 60a shows the in-plane strain ![]() 10 = (d10(z)-d10(unbent))/d10(unbent) of the carbon atoms within those graphene sheets, which are perfectly aligned along the fibre axis. The Symbols depict the results from scanning across the cross-section of the fibre, starting from the tension to the compression range. A perfectly linear dependence of the in-plane strain on the position across the bent fibre can be observed, shown for the case of very strong bending previous to rupture (squares, maximum tensile and compressive strain in the outer skin
10 = (d10(z)-d10(unbent))/d10(unbent) of the carbon atoms within those graphene sheets, which are perfectly aligned along the fibre axis. The Symbols depict the results from scanning across the cross-section of the fibre, starting from the tension to the compression range. A perfectly linear dependence of the in-plane strain on the position across the bent fibre can be observed, shown for the case of very strong bending previous to rupture (squares, maximum tensile and compressive strain in the outer skin ![]() max= 0.73%, fibre type HTA5131, Tenax industries, produced from PAN-precursor and subjected to a temperature treatment of 2100°C). However, a shift of the neutral axis from the centre towards the tension side reveals a stress re-distribution within the fibre, which is the consequence of an asymmetry of the tensile and the compression modulus. For comparison, the in-plane distances for a straight fibre are apparently constant (circles). In Figure 60b, the orientation distribution of the graphene sheets is visualised by the half-width at half-maximum
max= 0.73%, fibre type HTA5131, Tenax industries, produced from PAN-precursor and subjected to a temperature treatment of 2100°C). However, a shift of the neutral axis from the centre towards the tension side reveals a stress re-distribution within the fibre, which is the consequence of an asymmetry of the tensile and the compression modulus. For comparison, the in-plane distances for a straight fibre are apparently constant (circles). In Figure 60b, the orientation distribution of the graphene sheets is visualised by the half-width at half-maximum ![]() 002. A more pronounced preferred orientation of the graphene sheets is observed in the tension zone, the opposite in the compression zone. The same shift of the neutral zone towards the tension side suggests that buckling at the nanoscale of the graphene sheets is responsible for the different behaviour in tension and compression, since the decrease in orientation should result in a lower Young's modulus. Furthermore, a skin-core structure as proposed for this type of fibre already earlier in literature is clearly visible and can be quantitatively evaluated: A some 100 nm wide skin-region with a higher orientation (smaller
002. A more pronounced preferred orientation of the graphene sheets is observed in the tension zone, the opposite in the compression zone. The same shift of the neutral zone towards the tension side suggests that buckling at the nanoscale of the graphene sheets is responsible for the different behaviour in tension and compression, since the decrease in orientation should result in a lower Young's modulus. Furthermore, a skin-core structure as proposed for this type of fibre already earlier in literature is clearly visible and can be quantitatively evaluated: A some 100 nm wide skin-region with a higher orientation (smaller ![]() 002) can be observed, visible towards the outer bounds of the fibre.
002) can be observed, visible towards the outer bounds of the fibre.
In conclusion, scanning microbeam diffraction on fibres with a position resolution of 100 nm allows a precise determination of their inner structure. When combined with the application of mechanical loads, the local structural development can be measured at an atomic level, allowing a deeper understanding of the complex structure-function relationship at the nanoscale.
References
[1] S. Lagormasino, A. Cedola, S. Di-Fonzo, W. Jark, V. Mocella, J.B. Pelka, and C. Riekel, Cryst. Res. and Techn., 37, 758 (2002).
Principal Publications and Authors
D. Loidl (a), H. Peterlik (a), O. Paris (b), M. Burghammer (c).
(a) University of Vienna (Austria)
(b) Max-Planck-Institute of Colloids and Interfaces (Germany)
(c) ESRF


