- Home
- Users & Science
- Scientific Documentation
- ESRF Highlights
- ESRF Highlights 2011
- Electronic structure and magnetism
- Suppression of ferromagnetism in compressed 3d metals
Suppression of ferromagnetism in compressed 3d metals
The appearance of ferromagnetism in iron, cobalt and nickel is one of the most interesting phenomena currently under investigation in solid-state physics. In these transition metals, the magnetic properties arise from the partially filled spin-polarised 3d band which in turn is strongly related to the crystal structure and external factors such as temperature, magnetic field and pressure. The application of pressure is thus an effective way to study the complex interplay between magnetic, structural and electronic degrees of freedom. The compression of interatomic distances leads to a reduction of the density of states at the Fermi level to below the Stoner critical limit: suppression of ferromagnetism is therefore expected, as well as possible associated structural transitions.
The iron phase diagram has been widely investigated because of its geophysical interest. Upon compression, its ferromagnetic order vanishes around 16 GPa corresponding to the body centred cubic (bcc) to hexagonal close packed (hcp) structural transition. Similar investigations in the case of cobalt and nickel are far more challenging due to the higher pressures involved.
In cobalt, the ferromagnetic hcp phase is stable up to around 100-150 GPa where a structural phase transition to the face centred cubic (fcc) phase, predicted to be non-magnetic, occurs over an extended pressure range. Although estimated to occur at 150 GPa – i.e. at the end of the structural transition [1] – total suppression of ferromagnetism in Co had not yet been observed.
In nickel, no structural transitions have been reported up to 150 GPa and theory predicts fcc Ni to be stable up to 34 TPa. Being structurally stable over such a large pressure range, Ni offers a unique opportunity to investigate how magnetism is affected by the simple compression of interatomic distances. Previous experiments show a weak reduction of ferromagnetism with pressure, and theory predicts Ni to be still magnetic at 300 GPa [2]. Other calculations predict a transition to a paramagnetic state to occur around 160 GPa.
K-edge X-ray magnetic circular dichroism (XMCD) is nowadays the only magnetic probe allowing measurements on a sample under pressures of Mbars, while providing simultaneous structural information through the X-ray absorption near-edge spectrum (XANES). However, while the existence of a non zero K-edge XMCD signal clearly indicates the presence of ferromagnetic order, a complete understanding of the information carried by the signal is still required.
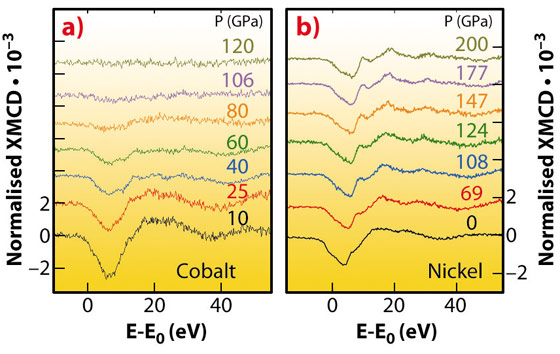
Our new results for cobalt (Figure 81a) provide the first experimental evidence of the pressure-induced extinction of ferromagnetism in Co and indicate that the magnetic response is somewhat independent of the structural transformation. The XMCD signal starts decreasing as soon as pressure is applied, whereas the onset of the hcp-fcc transition only occurs around 80 GPa. Moreover, extinction of ferromagnetism is observed around 120 GPa where simulations of the XANES spectra suggest that the structural transition is only half way through.
 |
|
Fig. 81: K-edge XMCD data for a) cobalt and b) nickel. |
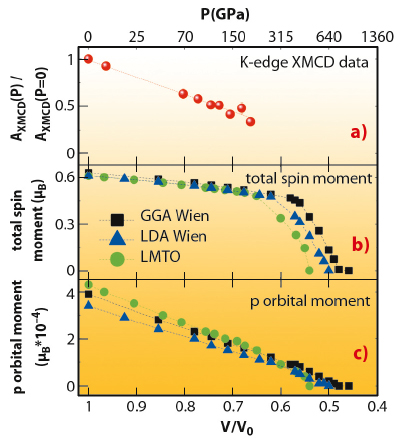
In the case of nickel, we find persistence of ferromagnetism at 200 GPa (Figure 81b), a record pressure for XAS, in contradiction to the prediction of a paramagnetic state. New density functional theory (DFT) calculations (Figure 82) show that the pressure evolution of the Ni K-edge XMCD closely follows that of the p projected orbital moment and not that of the total spin magnetisation, as was previously assumed [1]. The calculations also predict that the disappearance of magnetism in Ni will not occur below 400 GPa.
 |
|
Fig. 82: a) Volume evolution of the XMCD integral for nickel and b,c) comparison to DFT calculations. |
These results provide an important input to the interpretation of the K-edge XMCD and add benchmarks to the 3d metals phase diagrams.
Principal publication and authors
R. Torchio (a,b), A. Monza (c), F. Baudelet (c), S. Pascarelli (a), O. Mathon (a), E. Pugh (d), D. Antonangeli (e) and J. Paul Itié (c), Phys. Rev. B 84, 060403(R) (2011); R. Torchio (a,b), Y.O. Kvashnin (a), S. Pascarelli (a), O. Mathon (a), C. Marini (a), L. Genovese (a,f), P. Bruno (a), G. Garbarino (a), A. Dewaele (g), F. Occelli (g) and P. Loubeyre (g), Phys. Rev. Lett. 107, 237202 (2011).
(a) ESRF
(b) Dipartimento di Fisica, Università di Roma Tre (Italy)
(c) Synchrotron SOLEIL, Gif-sur-Yvette (France)
(d) Cavendish Laboratory, University of Cambridge (UK)
(e) Institut de Mineralogie et de Physique de Milieux Condensés, UMR CNRS 7590, Université Pierre et Marie Curie, Paris (France)
(f) Laboratoire de Simulation Atomistique, SP2M, UMR-E CEA / UJF-Grenoble 1, INAC (France)
(g) CEA, Bruyeres le-Chatel, Arpajon (France)
References
[1] V. Iota, J.H.P. Klepeis, C.S. Yoo, J. Lang, D. Haskel and G. Srajer, Appl. Phys. Lett. 90, 042505 (2007).
[2] T. Jarlborg, Physica C 385, 513 (2003).


