- Home
- Users & Science
- Scientific Documentation
- ESRF Highlights
- ESRF Highlights 2015
- Matter at extremes
- XAS: a novel approach to determine iron melting at megabar pressures
XAS: a novel approach to determine iron melting at megabar pressures
The core of the Earth is composed mainly of iron. The determination of the iron melting temperature at conditions in which the solid core of the Earth becomes liquid is one of the main concerns in geophysics as this value represents a fixed point in the thermal profile of our planet. The latter rules the heat flow from the core allowing us to understand the dynamo of the Earth and therefore has implications for the terrestrial magnetic field which, in turn, has influences for every living being on Earth. There is a long-standing controversy over the melting curve of Fe at the inner core boundary and here changes in X-ray absorption spectra are used as a criterion to detect melting under pressure.
The melting curve of iron at high pressure has been studied both experimentally and theoretically [1-4]. Nonetheless, a large plethora of results have been found with discrepancies up to 2000 K in the melting curve at the inner core boundary (ICB). Such discrepancies are too large to build unambiguous thermal evolution and dynamic models. X-ray absorption spectra have been used as a diagnostic tool to determine the solid-liquid phase boundary of iron compressed to over 100 GPa in a laser heated diamond anvil cell (LHDAC). X-ray absorption spectroscopy (XAS) is a chemically selective technique and the data contain solely the signal relative to the absorbing element without any interference from the sample environment. At the same time, it provides structural information within a few angstroms around the photoabsorbing atom maintaining the same sensitivity and accuracy regardless of the physical state of the investigated sample. These are assets with respect to diffraction techniques in which the onset of melting appears as a weak diffuse halo superimposed on strong Bragg reflections from partially molten sample and sample environment. In addition, by using XAS in the energy dispersive geometry available at beamline ID24, it is possible to quickly acquire the whole spectrum while using a small focal spot. These are significant advantages for studies of molten systems at high pressure with in situ LHDAC, in which samples are small and unstable under laser heating.
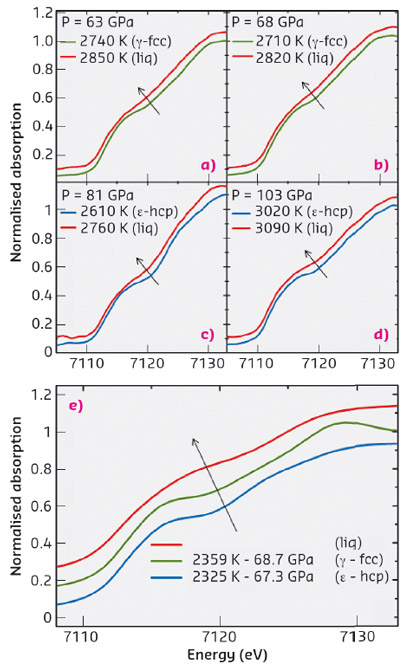
The melting criterion adopted here was based on changes occurring in the near-edge region of the absorption spectrum (XANES) that is known to be less affected by thermal damping and by the noise associated with extreme experimental conditions. Figure 99 (a-d) reports the XANES spectra at different pressures at the solid-to-liquid phase transition. At all recorded pressures and regardless of the structure of the solid phase, the modifications of the onset of the absorption can be used as a signature for the solid-liquid phase transition. In fact, the shoulder at the onset of the absorption is discontinuously smoothed out upon heating as shown by the arrows. The broadening with increasing temperature of the near edge part of the spectrum is ascribed to the thermal motion of the atoms. However at melting, the broadening increases discontinuously following the breakdown of crystalline order characteristic of the liquid phase. Figure 99e shows full multiple-scattering calculations to simulate the XANES region of the spectra at thermodynamic conditions comparable to the experimental ones. Consistent with the experimental data, the XANES calculation shows the same modifications of the feature between 7115 eV and 7120 eV in the liquid phase with respect to the solid phases characteristic of the disruption of the crystalline order.
 |
|
Fig. 99: (a-d) Experimental XANES spectra at 63, 68, 81, and 103 GPa respectively recorded at the solid-liquid phase transition. The arrows indicate the change in the onset of the absorption that can be used as diagnostic tool to detect melting. (e) Calculated XANES spectra of iron in the ε-hcp phase (blue line), γ-fcc phase (green line), and liquid phase (red line). |
The melting temperatures obtained in this work result in a flat melting curve around 100 GPa. Our results are in agreement with previous data to 200 GPa [1]. The latter suggests a melting temperature of iron below 5000 K when extrapolated to ICB conditions.
The combination of XAS and elevated pressure and temperature conditions offers great potential to probe Earth’s deep interior. In addition, the experiment reported here holds promises for studies related to the structure and phase diagram of compressed melts, the investigation of polyamorphism in the liquid phase or the extent of icosahedral ordering whose investigation has been limited until now to ambient conditions.
Principal publication and authors
Melting of iron determined by X-ray absorption spectroscopy to 100 GPa, G. Aquilanti (a), A. Trapananti (b), A. Karandikar (c,d), I. Kantor (e), C. Marini (e), O. Mathon (e), S. Pascarelli (e) and R. Boehler (c), PNAS (2015); doi: 10.1073/pnas.1502363112.
(a) Elettra–Sincrotrone Trieste S.C.p.A., Trieste (Italy)
(b) CNR–IOM, OGG Grenoble c/o ESRF, Grenoble (France)
(c) Geophysical Laboratory, Carnegie Institution of Washington, Washington DC (USA)
(d) Geowissenschaften, Goethe-Universität, Frankfurt a.M. (Germany)
(e) ESRF
References
[1] R. Boehler, Nature 363, 534–536 (1993).
[2] S. Anzellini et al., Science 340, 464–466 (2013).
[3] D. Alfè et al., Nature 401, 462 (1999).
[4] A. Laio et al., Science 287 1027 (2000).


