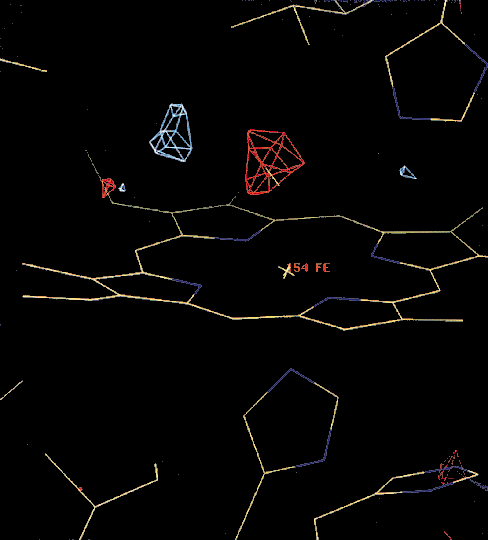
Figure 76

Fig. 76: Simulated single-pulse difference map of MbCO and Mb*CO contoured at ± 3![]() . The red pocket corresponds to the negative density from the removed CO molecule and the blue to the photo-excited state which is 4.1 Å from its original position. The simulation is in fair agreement with the measured map which will be published shortly in Science.
. The red pocket corresponds to the negative density from the removed CO molecule and the blue to the photo-excited state which is 4.1 Å from its original position. The simulation is in fair agreement with the measured map which will be published shortly in Science.


