- Home
- Users & Science
- Scientific Documentation
- ESRF Highlights
- ESRF Highlights 2006
- Surface and Interface Science
- X-ray standing wave imaging of Mn in GaAs
X-ray standing wave imaging of Mn in GaAs
The discovery of ferromagnetism in binary compound semiconductors doped with small amounts of magnetic elements has attracted great attention due to their potential applications in spintronic devices. GaMnAs is one of the prototype materials of such dilute magnetic semiconductors. It has achieved a Curie temperature (Tc) of 170 K at a Mn concentration of 5% [1]. Theoretical calculations [2] show that when substituting the Ga, the Mn acts as an acceptor with a local spin moment of 5/2 and ferromagnetic ordering can be mediated by the itinerant holes. However, depending on the growth conditions and post-growth treatments, small fractions of Mn may occupy the interstitial sites (Figure 96a), where it acts as a donor, compensating the hole doping, and thus decreasing Tc. Determining the site distribution of the Mn is therefore important in order to achieve an optimal Tc. However, as of now this had not been possible because of lack of reliable methods for characterising the structure of very dilute systems.
 |
|
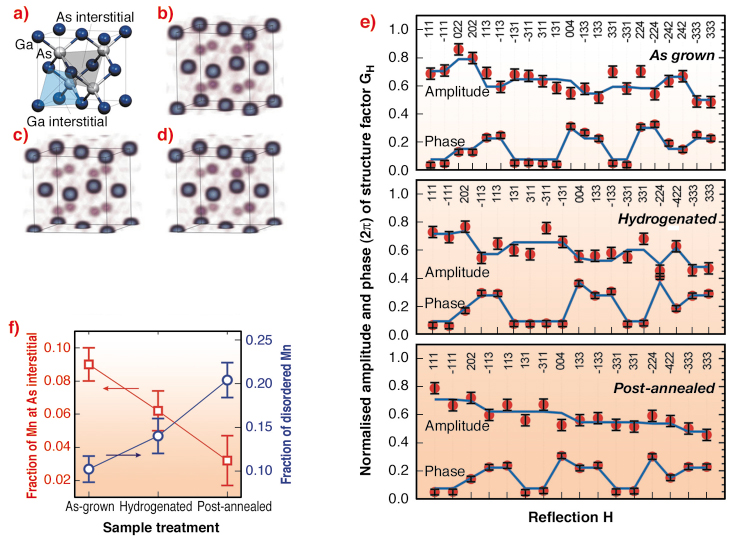
Fig. 96: a) Bulk structure of GaAs. The interstitial sites are located at the centres of the tetrahedrons. b) Direct image of Mn in the GaAs unit cell reconstructed from XSW measurements. c) and d) Simulated images of Mn assuming 100% and 90%, respectively, substitution of the Ga. In (d) the remaining 10% of the Mn is placed at the Ga interstitial sites. e) Measured (red dots) and refined (blue curves) amplitudes and phases of the Mn structure factors for the three samples. f) Site distribution and disorder of the Mn deduced from the structural refinement for the three post-growth treatments. It shows that up to 10% of the Mn occupies the As interstitial sites. |
In the present study carried out at ID32, X-ray standing waves (XSW) generated by substrate (hkl) Bragg reflections at a photon energy of 10 keV were used to locate the Mn in the GaAs lattice. For each reflection, the amplitude as well as the phase of the (hkl) Fourier component of the Mn distribution were determined by recording the Mn K![]() fluorescence during angular scans of the sample traversing the Bragg peak. Using a sufficiently large number of the reflections, a real-space image of Mn within the GaAs unit cell can be reconstructed via direct Fourier expansion.
fluorescence during angular scans of the sample traversing the Bragg peak. Using a sufficiently large number of the reflections, a real-space image of Mn within the GaAs unit cell can be reconstructed via direct Fourier expansion.
Four nm thick epitaxial layers of GaMnAs with 4% of Mn were prepared by low-temperature molecular beam epitaxy on GaAs(001). Three samples with different post-growth treatments (as-grown, hydrogenated, and low-temperature annealed) were used for the XSW experiment. Figure 96b shows the 3-dimensional image of Mn reconstructed from 22 reflections for the as-grown film. Compared to the bulk GaAs structure shown in Figure 96a, the measured image gives direct evidence that the majority of the Mn substitutes the Ga. The images also reveal a vertical lattice expansion of the film, which increases after hydrogenation. Figure 96c and Figure 96d present simulations using the same 22 reflections assuming that 100% and 90%, respectively, of the Mn substitutes the Ga. In Figure 96d the remaining 10% of the Mn is placed at the Ga interstitial sites. Comparison of Figure 96b with Figure 96c and Figure 96d leads to the further conclusion that no Mn substitutes the As or occupies the Ga interstitial sites, based on the observation that the intensities of the eight weaker spots inside the unit cell in Figure 96b appear identical. Figure 96c shows that these eight weaker spots arise mainly from the finite number of the Fourier components used in the expansion. Note that XSW imaging is limited to Fourier components given by the substrate (hkl) reflections. Due to the zinc blend symmetry, Mn atoms at the As interstitial sites are “invisible” as long as the majority substitutes the Ga.
To quantify the Mn site distribution, a structural model considering the Ga sites and As interstitial sites was introduced and refined. Figure 96e shows that this model, deduced from the images created by the Fourier expansion, is able to well reproduce the measured amplitudes and phases of the Fourier components of the Mn distribution for all three samples. The result of the refinement is summarised in Figure 96f, which provides the exact Mn site distributions for the different post-growth treatments and allows direct correlations between the structures and magnetic properties for dilute magnetic semiconductors.
References
[1] A.H. MacDonald, P. Schiffer and N. Samarth, Nature Materials 4, 195 (2005).
[2] T. Dietl, H. Ohno and F. Matsukura, Phys. Rev. B 63, 195205 (2001).
Principal Publication and Authors
T.-L. Lee (a), I. Joumard (a), J. Zegenhagen (a), W. Schoch (b), and M. Brandt (c)
(a) ESRF
(b) Abteilung Halbleiterphysik, Universität Ulm, Ulm (Germany)(c) Walter Schottky Institut, Technische Universität München, Garching (Germany)


