- Home
- Users & Science
- Scientific Documentation
- ESRF Highlights
- ESRF Highlights 2013
- Enabling technologies
- Automatic processing of MX diffraction data
Automatic processing of MX diffraction data
In the last decade of synchrotron macromolecular crystallography (MX) experiments, remarkable advances have been made in almost every aspect of the process. Automatic sample changing, high-brilliance beams and high-speed detectors have all contributed to a dramatic reduction in the amount of time required for even the most complex MX experiments. However, the ability to collect at extremely high rates does not come without problems: users have less “idle” time to prepare their experiment and analyse their results. Thus, it has become necessary for new advanced tools to be developed, to quickly and accurately plan diffraction experiments [1], and to provide rapid feedback to the user on the quality of the data that has been collected. This work focuses on the latter of the two tools, feedback on data quality.
In the Spring of 2010, after work from various ESRF and EMBL groups and initial testing on ID23-EH2, a system for the automatic processing of data was deployed on all MX insertion device beamlines. While this initial version was quite successful, it has been continuously improved to reach the current system, which now offers state of the art feedback to all MX users.
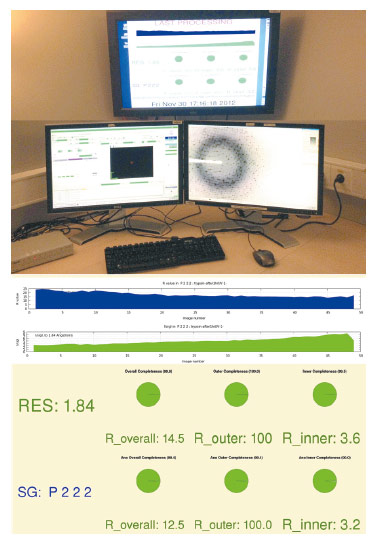
Since the very beginning, a double-headed approach has been employed towards data processing that analyses the same data in multiple ways, using multiple subsystems. The first subsystem is engineered to produce a rough but very high-speed processing of the data for the user, without using many of the known techniques to incrementally improve data quality. The processed data is available to the user shortly after the data collection has ended (currently 10 seconds to 2 minutes after the end of the data collection) both on the file system, the ISPyB database [2], and via a dedicated monitor (Figure 145).
 |
|
Fig. 145: Data collection feedback at beamline ID23-2. |
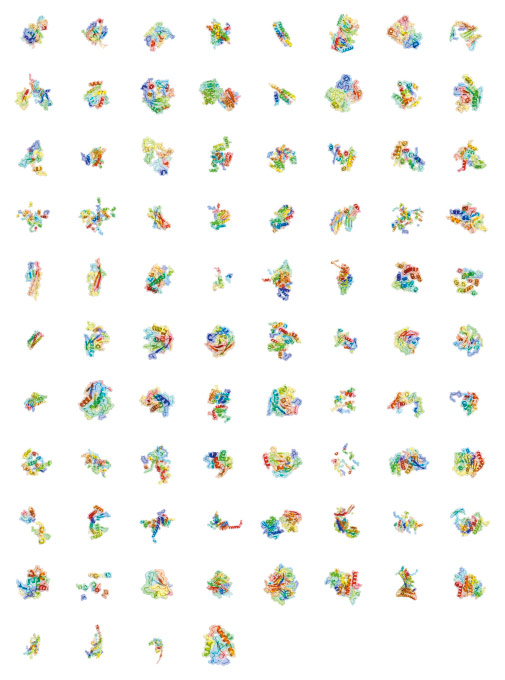
The second subsystem attempts to emulate the steps that would be taken by an experienced crystallographer, to produce the highest quality data processing, albeit at the expense of run time. Data from this subsystem is indeed of sufficient quality to often facilitate the determination of experimental phases automatically, and without any user intervention. A selection of the structures that have been determined automatically is presented in Figure 146.
 |
|
Fig. 146: A selection of structures that have been solved automatically. |
Without an intuitive mechanism for the user to browse the results of these data reductions, all of this effort would be of limited use. Therefore, significant effort has gone into expanding the data model of ISPyB to handle different data collection types, the auto-processing data, and even the auto-structure determination data. The result of this is a clean and user-friendly interface that allows the user to rapidly compare the data quality from different datasets, view inline graphs of data quality and download the processed files.
These two systems have evolved significantly in their speed and robustness over the last three years, to the point now that they are simply part of the portfolio of ESRF services that users expect.
Principal publication and authors
S. Monaco (a), E. Gordon (a), M.W. Bowler (b,c), S. Delagenière (a), M. Guijarro (a), D. Spruce (a), O. Svensson (a), S.M. McSweeney (a), A.A. McCarthy (b,c), G. Leonard (a) and M.H. Nanao (b,c), J. Appl. Cryst. 46, 804-810 (2013).
(a) ESRF
(b) European Molecular Biology Laboratory, Grenoble (France)
(c) Unit of Virus Host–Cell Interactions, UJF-EMBL-CNRS, UMI 3265, Grenoble (France)
References
[1] G.P. Bourenkov and A.N. Popov, Acta Crystallogr D Biol Crystallogr. 66, 409-19 (2010).
[2] S. Delagenière, P. Brenchereau, L. Launer, A.W. Ashton, R. Leal, S. Veyrier, J. Gabadinho, E.J. Gordon, S.D. Jones, K.E. Levik, S.M. McSweeney, S. Monaco, M. Nanao, D. Spruce, O. Svensson, M.A. Walsh and G.A. Leonard, Bioinformatics 27, 3186-92 (2011).


