- Home
- News
- Spotlight on Science
- Measurement of Femtometre-scal...
Measurement of Femtometre-scale Atomic Displacements by X-ray Absorption Spectroscopy
13-05-2005
A dispersive X-ray spectrometer was employed to make rapid measurements of the difference in EXAFS of a material undergoing periodic strain. This new technique uses X-rays to look at the movement of atoms with a resolution 100 times better than ever achieved before.
The dispersive X-ray spectrometer is installed on beamline ID24. It has no moving components and can make rapid measurements to minimise energy drift, which can mask real changes. Using the spectrometer, we have recorded the differential EXAFS in an iron-cobalt thin film. The strain was created by Joule Magnetostriction, which is the phenomenon whereby strain is created by magnetisation rotation. Here we show that magnetostriction can be detected by differential X-ray absorption and that the magnitude of the recorded signal, relative to the noise present in the data, shows that a sensitivity to mean differential atomic motion of one femto-metre has been achieved. This is a factor of 100 times more sensitive than normally available.
 |
|
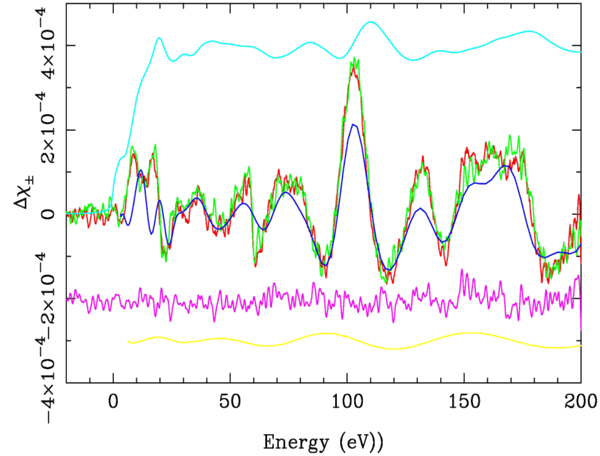
Fig. 1: The magnetostrictive differential EXAFS signal (red or green curve) compared to the theoretical calculation (dark blue curve). Further details are given in the text.
|
Measurements were carried out at the Fe K-edge on a thin FeCo polycrystalline film (light blue curve). Transmitted intensity measurements were made repeatedly at every 90° angle between the magnetisation vector and the photon polarisation vector. The differential absorption was calculated from the transmitted intensities. The experiment was repeated but this time the magnet was rotated 90° in phase with respect to the previous measurements. This should invert the signal. The two curves, one multiplied by -1, are shown in Figure 1 (red and green curves).
We calculated the expected differential fine structure signal using the assumption that the macroscopic magnetostriction tensor holds at the microscopic level. This calculated signal is superimposed to the experimental data (dark blue curve). It is clear that the main features of the measurement have been reproduced even down to the difficult region below 30 eV, where we know that our theory is inadequate.
Also visible in Figure 1 is the comparison of the noise of the data (purple noisy line) with a calculated signal (yellow curve) that would come from an average interatomic strain in the first shell of 1 fm. If just the first shell structure were visible, then this displacement would be measurable. We can therefore claim that we have sensitivity to mean interatomic displacements of about 1 fm.
 |
|
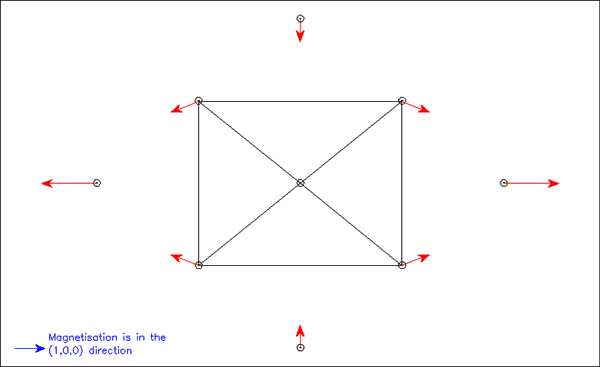
Fig. 2: Atomic displacements of FeCo bcc lattice when magnetisation vector rotates from 100 to 010 direction (Please click on image to view animation, 350 kb). |
This technique gives us a new insight into atomic movements that will allow better understanding of structures on the atomic scale. This could lead to improvements in a wide range of technologies including data storage media.
Authors and Principal Publication
R.F. Pettifer (a), O. Mathon (b), S. Pascarelli (b), M.D. Cooke (c), M.R.J. Gibbs (c), Nature 435, 79-81 (2005).
(a) Department of Physics, University of Warwick, Coventry (UK)
(b) ESRF
(c) Department of Engineering Materials, University of Sheffield (UK)


