- Home
- Users & Science
- Find a beamline
- Collaborating research group beamlines
- BM26 - DUBBLE - Dual Belgian Beamlines
- BM26: SAXS/WAXS
- Data Reduction and Analysis
Data Reduction and Analysis
Data reduction
To make your data processing easier, we provide the essential software tools for data reduction.
- SAXS images are "reduced" by performing a number of necessary corrections (intensity normalization, background subtraction, q-calibration, ...), followed by an azimuthal integration. The data formats currently supported are: BSL, edf, tiff, and hdf5/nexus.
- WAXS data are processed in order to correct the geometrical distortion due to detector's position, and to calculate the diffracted intensity via azimuthal integration. The correction steps are performed using matlab based macros (see short presentation bellow).
Here you can find some basic documentation on SAXS.
The data reduction programs will be set up by your local contact at the beginning of your experiment.
Running BUBBLE for Data Integration
On BM26 we use BUBBLE for automatically processing (= integrate/reduce) your images on-line during your experiment, given a known calibration (.poni file) and masks files. Here we suppose you do have a .poni file and mask files for your experiment.
Here you can find information on Bubble and download links: BUBBLE. For running Bubble, you need to run Bubble server and Bubble client. You can run Bubble (server, Bubbles, and client, Bubblec) on any machine (Windows PC or Linux) that has access to your experimental data, which is that it either has them stored on a local disk, or that it has the ESRF /data/visitor/yourexpename/bm26/ data directory mounted.
On a Linux machine, just type bubbles. This will launch Bubble server and then Bubble client automatically.
On a Windows machine, dubble click on the bubbles icon and then on the bubblec icons. The Bubble client GUI will appear. It contains three tabs:
In the middle rectangular box of the first tab, choose Dubble beamline.
In the Server tabs, tick Subfolder and give the name of the subfolder you want to contain your reduced images (bubble_extracted_bkg_sub, in this example). Tick Extension and give the extension name you wish for your files (.dat in this example, but it can be anything, .xye, .epf...).
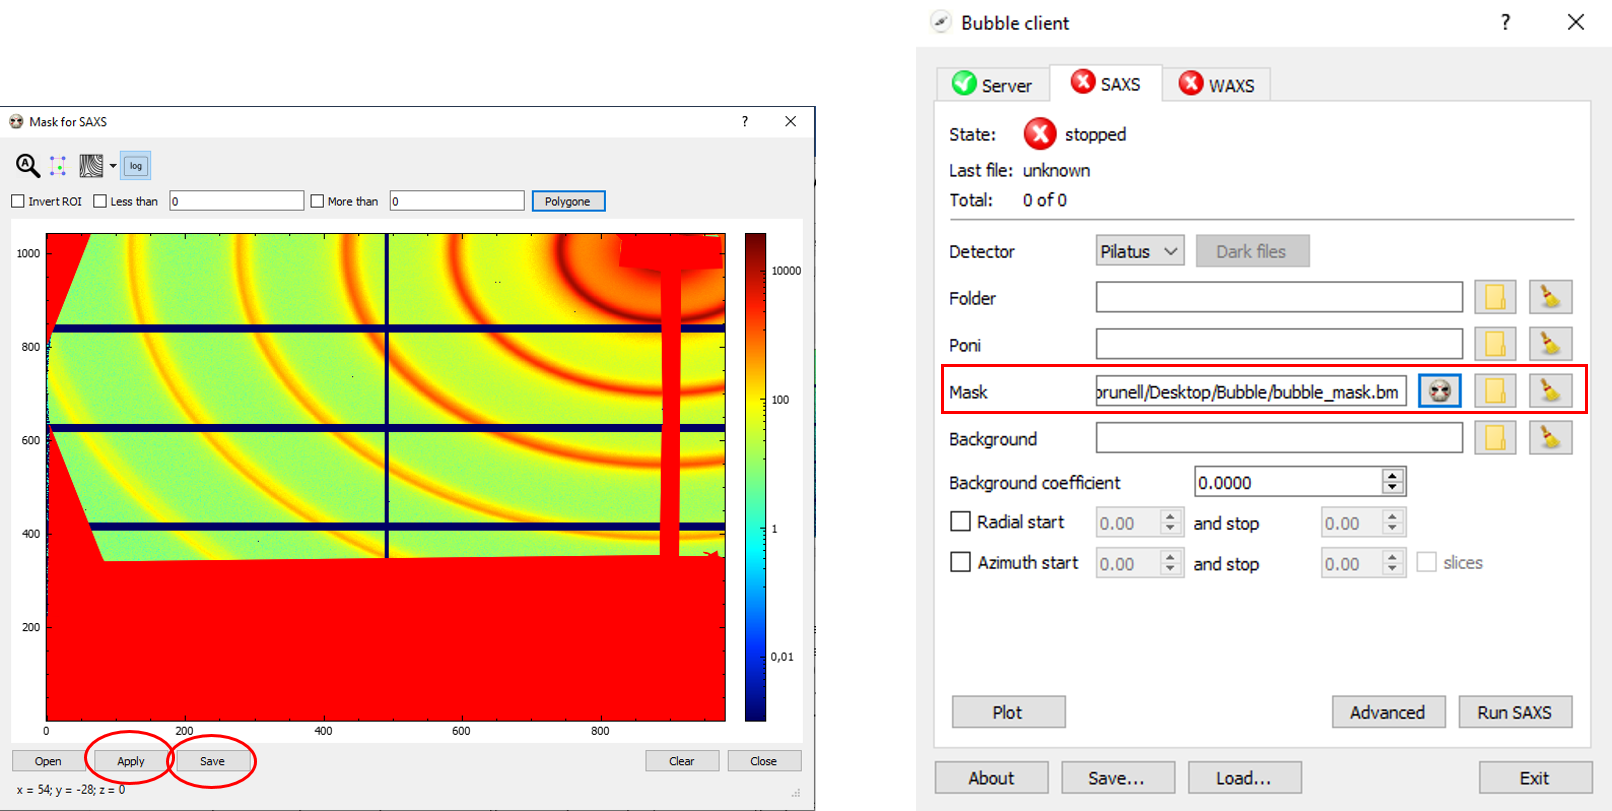
In the SAXS tabs, click on the folder icon on the Folder line in order to specify the data folder you want to process (X:/bm262839/bm26/SL_run1/SAXS, in this example). Then click on the folder icon on the Poni line in order to specify the .poni file to use for SAXS calibration (X:/bm262839/bm26/ag_be/SAXS/SAXS_calib.poni, in this example). Then click on the folder icon on the Mask line in order to specify the mask file to use for your detector (X:/bm262839/bm26/ag_be/SAXS/fit2d_SAXS.msk, in this example). Finally, if you wish to systematically subtract a background for your samples, select the image by clicking on the folder icon on the Background line. Finally click on Run SAXS.
In the WAXS tabs, click on the folder icon on the Folder line in order to specify the data folder you want to process (X:/bm262839/bm26/SL_run1/WAXS, in this example). Then click on the folder icon on the Poni line in order to specify the .poni file to use for SAXS calibration (X:/bm262839/bm26/alpha_al/WAXS/WAXS_calib.poni, in this example). Then click on the folder icon on the Mask line in order to specify the mask file to use for your detector (X:/bm262839/bm26/ag_be/SAXS/fit2d_WAXS.msk, in this example).
./How to create a mask file into Bubble:
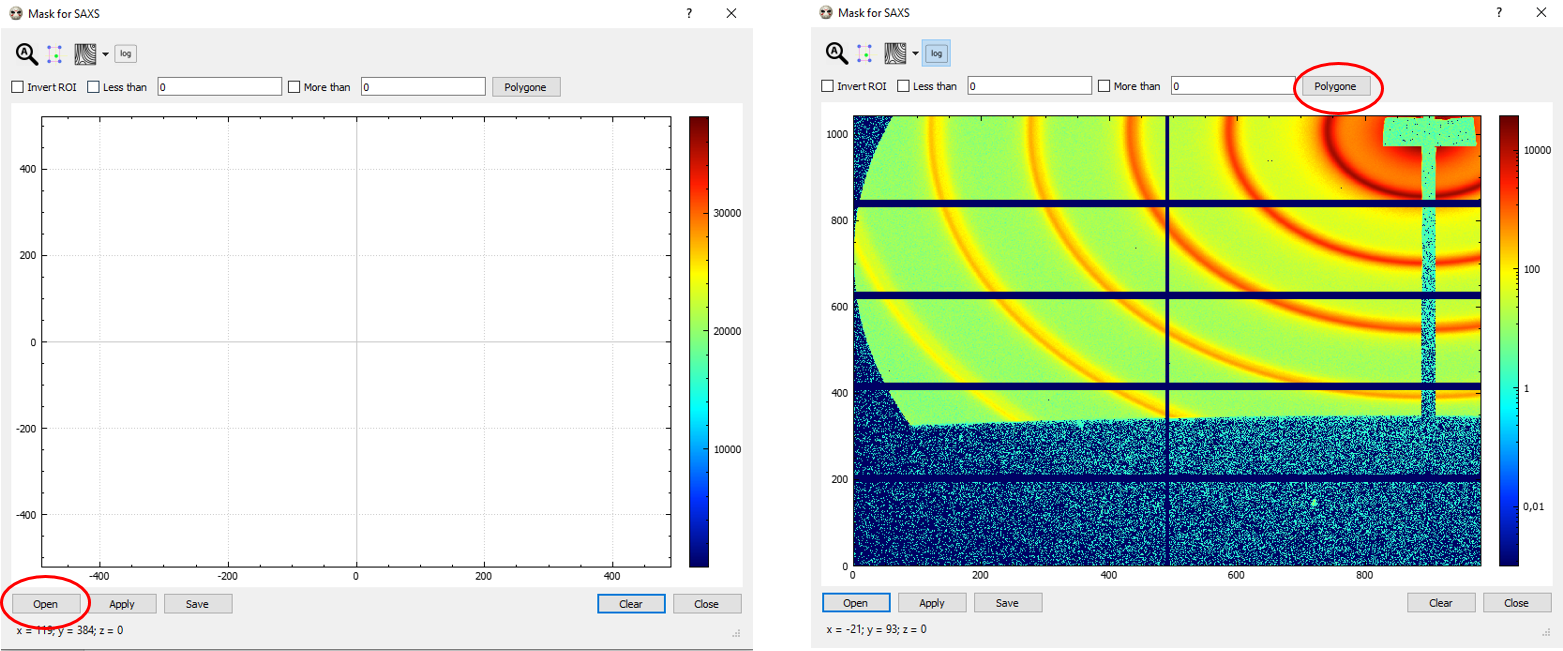
Both for your SAXS and for your WAXS measurements, you can create a mask file into Bubble. In the corresponding SAXS/WAXS tabs, this is done by clicking on the mask icon:
![]()
Click on “Open” (bottom-left corner) to open an image for creating the mask file (typically the standard, Ag-Be or Alumina, but not necessarily). For better visualizing the intensities in the image, you might want to opt for log scale (fourth “log” button on the top) and adjust the scale using the colorbar on the right.

Choose “Polygone” (top-right) for drawing the areas to mask in your images (typically, the beam stop shadow, any other undesired area and/or spot; please note that, in-between gaps of the detector with -1 intensities are automatically discarded by Bubble, so you won’t need to mask those). Double-click for closing the polygon. At the end of the mask making process, you can either click on “Apply” (bottom left) and the mask will be applied in your integration but not saved, or else on “Save” if you want to save the mask file for further use. In this second case, you have to pick a name and a folder for your .bm mask file to be selected afterwards. In the example below (figure on the right), filename is bubble_mask.bm.

In the same way, in the WAXS tab, you can create a mask for your WAXS measurements.
Finally, if you wish to systematically subtract a background for your samples, select the image by clicking on the folder icon on the Background line. Finally click on Run WAXS.
In both cases, Pilatus detector has to be chosen (unless you are using the Frelon camera).
If everything went OK, all you red crosses are now green:
In the Server tab, you can use Option to give more options for your integration, such as: Dubble precision (recommended), Polarization correction, Number of bins (trials and error; it depends on the scattering of our sample).
The Wiki page of the beamline (ONLY ACCESIBLE on-site!) contains similar instruction.
Need to visualize images?
If you need to visualize your diffraction images you can use:
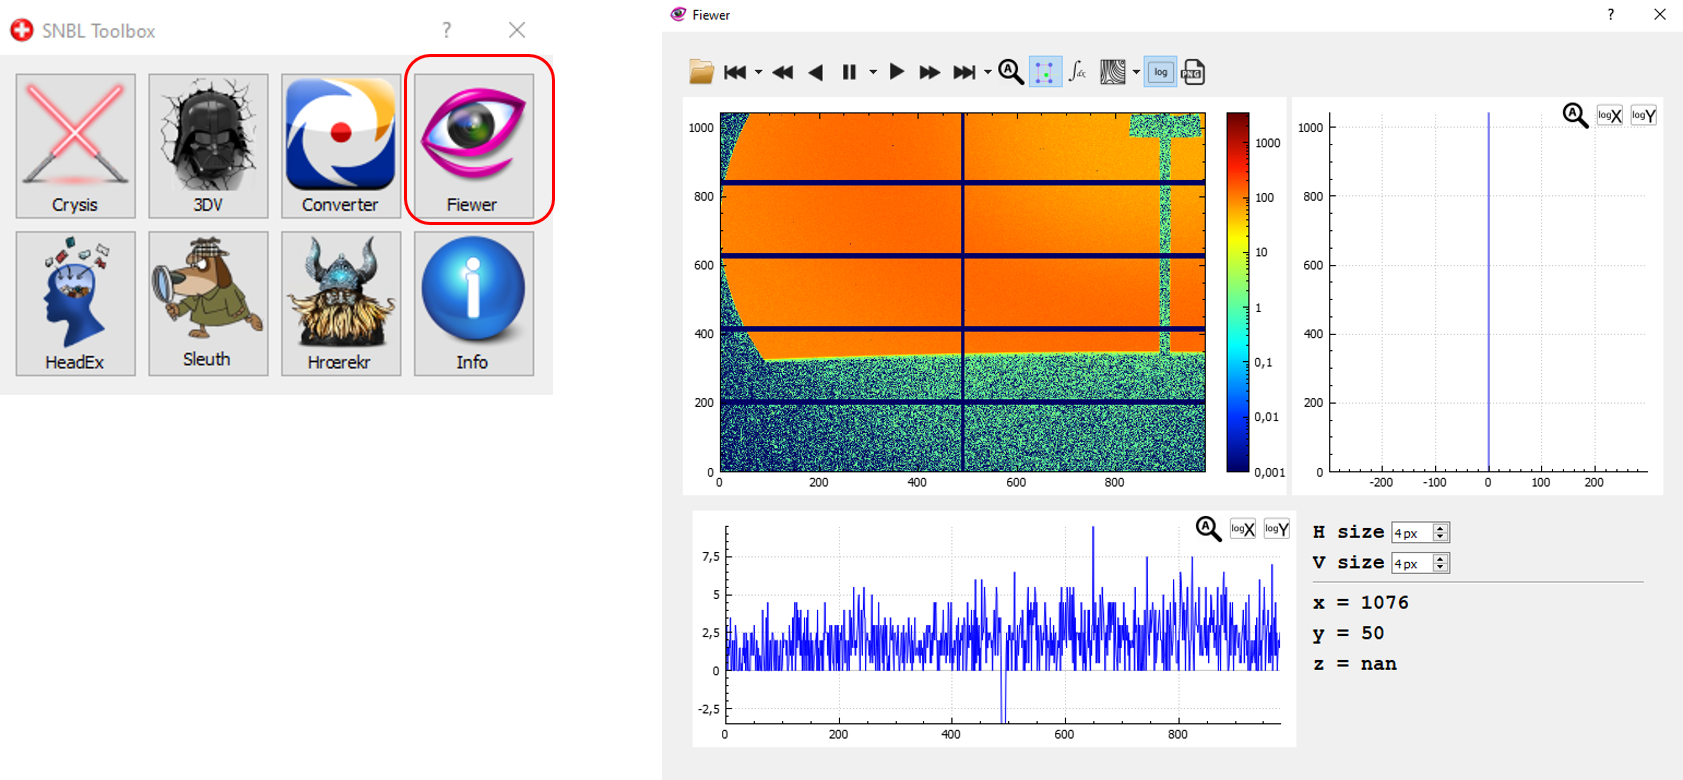
- Fiewer, into the SNBL Toobox, downloadable here and looks like:
- FIT2D (see also below)
- FabIO Viewer, a simple diffraction image viewer based on matplotlib and PyQt4: fabio_viewer
Links to other programs:
| FIT2D |
FIT2D is both a general purpose and specialist 1 and 2 dimensional data analysis program, quite popular among ESRF users. It can be used for both interactive and "batch" data processing. You may need to enter the detector pixel size: 172 µm (square) for the Pilatus detectors |
| pyFAI |
pyFAI-calib and pyFAI-calib2 (with a GUI) can be used to calibrate the diffraction setup geometry based on Debye-Sherrer ring images without much a priori knowledge of your setup, but you must correctly identify the diffraction rings based on a calibrant or a “d-spacing” file (containing the spacings of Miller planes in Ångstroms of your calibrant; largest first). Ring 0 corresponds to the largest d-spacing in the file, but is not always the first you can see on the detector - the program needs to be told the right number! You also need to know the X-ray wavelength. Inside the ESRF the program can be called from a LINUX window. pyFAI-saxs uses the parameters obtained with pyFAI-calib (output as a file with extension .poni) to perform azimuthal integrations with output by default in Intensity vs q (in nm-1) giving a file with extension .dat. Output is possible with units of A-1 or as I vs scattering angle 2theta (degrees) or with a user defined extension. The mask can be generated using FIT2D Example use: pyFAI-saxs -m maskfile.msk -p calibrantFilename.poni -n 2000 dataFilename.edf |
| ConeX | ConeX is a program for the angular calibration of flat 2D detectors in the context of scattering by isotropic samples, notably of X-rays. The purpose of the software is to average the 2D images recorded by the detector into 1D scattering patterns. Follow the link to get the software package. |
| DAWN |
DAWN, the Data Analysis WorkbeNch, is an Eclipse based application for scientific data analysis mainly developed at the Diamond Light Source. It can be used for visualisation and processing of 2D Powder Diffraction and Small Angle X-ray Scattering (SAXS) data, for calibration and data reduction.
|
More details here: data reduction
Data analysis
| OMIC tools | A suite of programs particularly useful for analysing SAXS data from biological macromolecules |
| Information content | How much information do you have in your SAXS profile? When is your model a good fit to the data? Rob Rambo's information theory led analysis is worth reading. doi: 10.1038/nature12070 |
Detector response
When you proceed to data reduction, you may need the response of the detector you used:
- old: response of the CCD camera
- old: response of the multiwire gas-filled 2D detector in use since Sep 2009
- old: response of the multiwire gas-filled 2D detector in use since July 2009
- old: response of the multiwire gas-filled 2D detector in use since Oct 3rd 2008
- old: response of the previous multiwire gas-filled 2D detector (July 2008).
Pilatus detectors do not require correction for detector response (they do require a mask for dead and obstructed areas)
Other links
| CCP13 | CCP13 is the Collaborative Computational Project for fibre diffraction. The project has been refunded to support research fellows working on data extraction from diffraction patterns recorded at x-ray and neutron beam sources. The CCP13 suite has been installed on a variety of platforms running UNIX based operating systems. |
| canSAS | Collective Action for Nomadic Small-Angle Scatterers |


