- Home
- Users & Science
- Find a beamline
- Structural biology
- How to use our beamlines
- Run Your Experiment
- EDNA Burn Strategy
EDNA Burn Strategy
Details of how to use the Burn strategy in EDNA
Induced Radiation Damage Procedure
The induced radiation damage procedure is a method to automatically characterise the radiation sensitivity of a crystal. This method determines the crystal sensitivity through a preliminary experiment, sacrificing a whole or part of a sample. It is therefore suitable for systems where several identical crystals are available or one single large crystal.

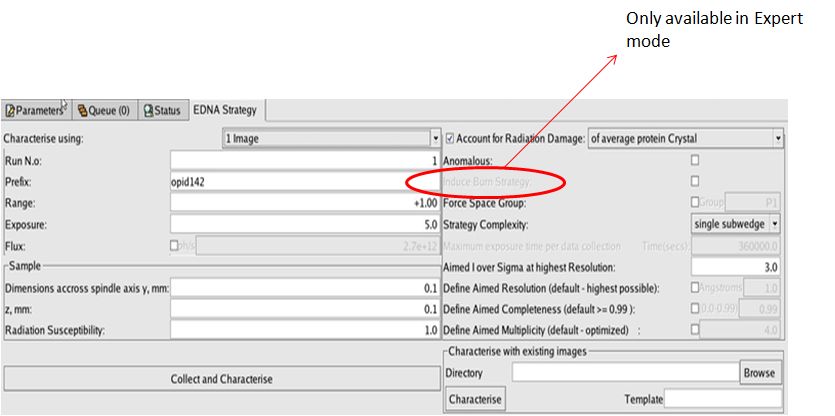
In the EDNA tab of mxCuBE select the check box ' Burn Strategy'. Take reference images of the crystal you wish to sacrifice and EDNA will calculate a data collection burning strategy. Collect the data according to the strategy proposed by EDNA.
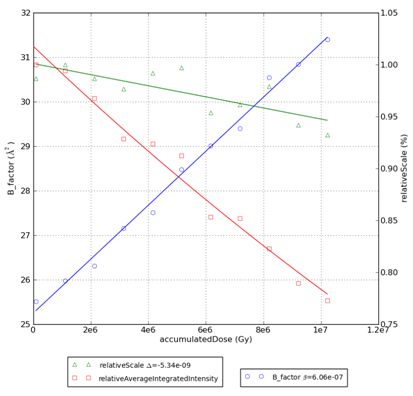
The crystal sensitivity is determined through the slope of the linear dependence of overall isotropic B-factor with absorbed dose: the β value, or crystal sensitivity coefficient.
In general, this value is expected to be β ≈ 1 A2 MGy-1 for the majority of protein crystals.
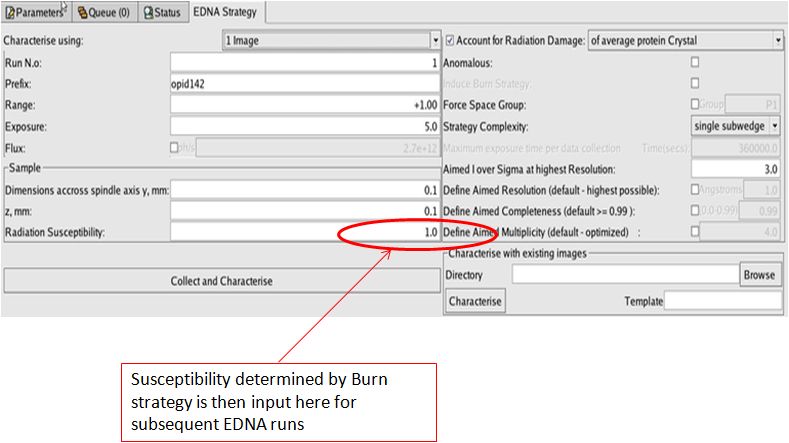
The slope of the B-factor vs Dose – β – can then be used in EDNA (field “crystal susceptibility”) for optimal planning of data collection while accounting for radiation damage.
Large values of beta : β > 1e-6 : crystal is very sensitive to radiation damage
Large values of beta : β < 1e-6 : crystal is less prone to radiation damage
Examples:
1. if the determined β were to be 2.23e-6, the user should input in the field “crystal susceptibility” 2.23.
2. if the determined β were to be 4.50e-5, the user should input in the field “crystal susceptibility” 45

Please cite :
Leal et al., “Experimental procedure for the characterization of radiation damage in macromolecular crystals”, Journal of Synchrotron Radiation (Volume 18, Part 3), for any experiments that used the induced radiation damage characterisation protocol.
Log file:
To see the log file while the diffraction images are being collected use the command below:
tail -f /tmp/InducedRadDam.log
While images are being collected, condor is processing the data in the background. At the end of the last cycle, the application waits for all condor jobs to finish and launches the computation of the results.
See below problems that might occur during this step.
Normal termination:
After the last diffraction image is collected, the result plots should pop up on the screen within 1 or 2 minutes. If they do not appear, see problems “Condor jobs hung” below.
Normal termination log:
2011-02-24 17:13:55,596 - root - <INFO> - /usr/local/condor/bin/condor_q | grep leal | egrep 'condor_dagman|xds':
395239.0 leal 2/24 17:11 0+00:02:46 R 0 7.3 condor_dagman
395248.0 leal 2/24 17:11 0+00:00:43 R 0 0.0 xds
2011-02-24 17:13:55,597 - root - <INFO> - Sleeping for 10 seconds: Waiting for the jobs to stop...
2011-02-24 17:14:05,666 - root - <INFO> - Jobs finished
2011-02-24 17:14:05,666 - root - <INFO> - Analysing the data...
Results:
A plot will pop up in the window and the following file will be written to the PROCESSED_DATA/<name> folder:

<prefix>.png – plot
<prefix>.svg – plot in svg format (vectorial format)
<prefix>.csv – tab separated text file (can be opened in MS Excel)
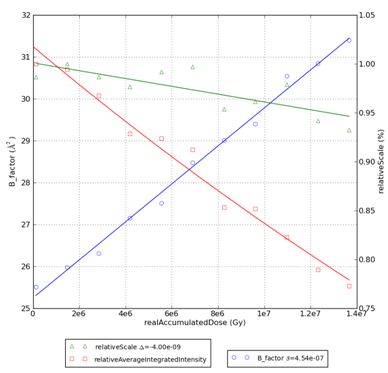
The accumulated dose (X axis in the plot) is calculated by default for an “average protein crystal” (47% solvent content, 0.05 sulphurs per amino acid residue, 300 mM sulphur in the buffer solution) . If the crystal contents are known, a file named raddose.ini can be created in the PROCESSED_DATA/<name> folder. This ini file will be used to determine the real dose absorbed by the crystal. All raddose keywords (see http://biop.ox.ac.uk/www/garman/lab_tools.html#guide8 ) can be define on this file. It has the following form:
# number of residues
NRES = 154
# number of atoms different from H,O,C in the asymmetric unit
PATM = S 5 FE 2
# Crystallisation solvent concentrations in the drop
SATM = S 850
If the raddose.ini is provided, a second plot will pop up on the screen (note the X-axis label: real accumulated dose) and three additional files will be created:

<prefix>_real.png – plot
<prefix>_real.svg – plot in svg format (vectorial format)
<prefix>_real.csv – tab separated text file (can be opened in MS Excel)
Problems:
Command Line help can be obtained at any moment with:
InducedRadDam.py –h
Condor jobs hung
Xds jobs should not last more than 2 minutes.
Usual log:
2011-02-24 17:11:54,735 - root - <INFO> - /usr/local/condor/bin/condor_q | grep leal | egrep 'condor_dagman|xds':
395235.0 leal 2/24 17:10 0+00:00:57 R 0 7.3 condor_dagman
395236.0 leal 2/24 17:11 0+00:00:51 R 0 7.3 condor_dagman
395237.0 leal 2/24 17:11 0+00:00:51 R 0 7.3 condor_dagman
395239.0 leal 2/24 17:11 0+00:00:45 R 0 7.3 condor_dagman
395240.0 leal 2/24 17:11 0+00:00:39 R 0 7.3 condor_dagman
395241.0 leal 2/24 17:11 0+00:00:39 R 0 7.3 condor_dagman
395242.0 leal 2/24 17:11 0+00:00:39 R 0 7.3 condor_dagman
395243.0 leal 2/24 17:11 0+00:00:39 R 0 7.3 condor_dagman
395244.0 leal 2/24 17:11 0+00:00:39 R 0 7.3 condor_dagman
395245.0 leal 2/24 17:11 0+00:00:39 R 0 7.3 condor_dagman
395246.0 leal 2/24 17:11 0+00:00:22 R 0 0.0 xds
395247.0 leal 2/24 17:11 0+00:00:22 R 0 0.0 xds
395248.0 leal 2/24 17:11 0+00:00:22 R 0 0.0 xds
395249.0 leal 2/24 17:11 0+00:00:22 R 0 0.0 xds
395250.0 leal 2/24 17:11 0+00:00:22 R 0 0.0 xds
395251.0 leal 2/24 17:11 0+00:00:22 R 0 0.0 xds
395252.0 leal 2/24 17:11 0+00:00:22 R 0 0.0 xds
395253.0 leal 2/24 17:11 0+00:00:22 R 0 0.0 xds
395254.0 leal 2/24 17:11 0+00:00:22 R 0 0.0 xds
395255.0 leal 2/24 17:11 0+00:00:22 R 0 0.0 xds
2011-02-24 17:11:54,735 - root - <INFO> - Sleeping for 10 seconds: Waiting for the jobs to stop...
If the message “Sleeping for 10 seconds: Waiting for the jobs to stop...” still appears and XDS jobs are running “R” or idle “I”, for more than 2 minutes, condor jobs should be removed typing the following command:
condor_rm <user name that launch the jobs. E.g. opid23,opid29,etc>
To verify which jobs did not complete successfully, one can search for folders where the XDS_ASCII.HKL does not exist:
[mx231 6] 24963 > find . -maxdepth 2 -name "XDS_ASCII.HKL"
./xds_A2-24963w3_run1_1/XDS_ASCII.HKL
./xds_A2-24963w5_run1_1/XDS_ASCII.HKL
./xds_A2-24963w7_run1_1/XDS_ASCII.HKL
./xds_A2-24963w11_run1_1/XDS_ASCII.HKL
./xds_A2-24963w13_run1_1/XDS_ASCII.HKL
./xds_A2-24963w15_run1_1/XDS_ASCII.HKL
./xds_A2-24963w17_run1_1/XDS_ASCII.HKL
./xds_A2-24963w19_run1_1/XDS_ASCII.HKL
./xds_A2-24963w21_run1_1/XDS_ASCII.HKL
Note that for the burning protocol odd numbered wedges contain diffraction data, while even numbered wedges are burning wedges: for the latter there are no diffraction images, therefore, it is only expected to have the integrated intensities file in the odd wedge numbered folders. In this case wedge 1 and 9 are missing.
To process the data manually, one should go to the folders 1 and 9 and execute:
xds_par
Followed by:
./best.sh
Then, to call the procedure again and plot the graphs, type:
InducedRadDam.py-i -e <edna folder name> -p <last xds folder created, usually wedge 21> -s
The EDNA folder can be found with an “ls –lrt” and is the last EDNA folder before the mosflm/xds folder appear. E.g:
[11:21 0.01 /data/visitor/ix5/id29/20110224/PROCESSED_DATA/A2/24963 ]
[mx231 13] 24963 > ls -lrt
total 13036
-rw-rw-rw- 1 opid29 jsbg 2427 Feb 24 16:15 EDNAInput_840480.xml
-rwxrwxrwx 1 opid29 jsbg 363 Feb 24 16:15 edna_start_20110224_161538_153274000.sh*
-rw-rw-rw- 1 opid29 jsbg 504451 Feb 24 16:16 EDNAOutput_840480.xml
-rw-rw-rw- 1 opid29 jsbg 25716 Feb 24 16:16 EDApplication_20110224-161540.log
drwxrwxrwx 3 opid29 jsbg 4096 Feb 24 16:16 EDApplication_20110224-161540/
lrwxrwxrwx 1 opid29 jsbg 49 Feb 24 16:21 links -> /data/visitor/ix5/id29/20110224/RAW_DATA/A2/24963/
drwxrwxrwx 2 opid29 jsbg 4096 Feb 24 16:21 mosflm_A2-24963w1_run1_1/
For this particular case the command would be:
InducedRadDam.py -i -e EDApplication_20110224-161540 -p /data/visitor/ix5/id29/20110224/PROCESSED_DATA/A2/24963/xds_A2-24963w11_run1_1 -s
Re-launch the whole process
If needed, all process can be re-launched (including condor jobs!):
/opt/pxsoft/tools/python/v2.6.6/redhate5-x86_64/bin/python /opt/pxsoft/InducedRadDam/vdefault/linux/reprocess.py -e <edna folder name> -p <xds template folder: use ? for the wedge numbers> -s <first wedge number> -f <last wedge number>
Example of a real command:
/opt/pxsoft/tools/python/v2.6.6/redhate5-x86_64/bin/python /opt/pxsoft/InducedRadDam/vdefault/linux/reprocess.py -e EDApplication_20101126-102025 -p 'xds_t1w?_run1_1' -s 1 -f 21
Customised burning protocols
The user can also build his own induced radiation damage protocol. For this the queue should be filled in with several wedges. These wedges should then be collected, and once finished, the procedure can be launched. The command below should be typed in the folder where the mosflm/xds folders were created:
/opt/pxsoft/tools/python/v2.6.6_20110126/redhate5-x86_64/bin/python /opt/pxsoft/InducedRadDam/vdefault/linux/reprocess.py -e <edna folder name> -p <template xds folder> -s <start wedge number> -f <final wedge number> -t <step between wedges>
Example of a real command for 15 wedges numerated from 1 to 15 with XDS folder names of the form 'xds_x1_run#_1':
/opt/pxsoft/tools/python/v2.6.6_20110126/redhate5-x86_64/bin/python /opt/pxsoft/InducedRadDam/vdefault/linux/reprocess.py -e EDApplication_20101126-102025 -p 'xds_x1_run?_1' -s 1 -f 15 -t 1
Help for the reprocess command can be obtained with:
/opt/pxsoft/tools/python/v2.6.6/redhate5-x86_64/bin/python /opt/pxsoft/InducedRadDam/vdefault/linux/reprocess.py –h
Please provide comments and feedback to ricardo.leal@esrf.fr and apopov@esrf.fr


