Figure 105

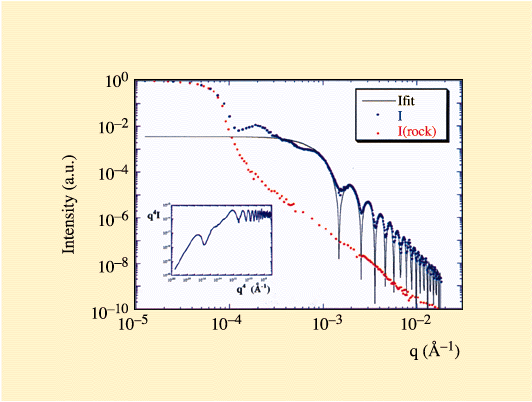
Fig. 105: The scattering profile of a solution of silica spheres (Stöber type, 600 nm diameter and a volume fraction around 10 %) in ethylene glycol solvent. We evidence (red line) with a very high resolution the intensity oscillations from the form factor of spheres (oscillations at large scattering vectors q = 4![]() sin
sin![]() /
/ ![]() ) and the liquid order (at ultra-low q values). The raw data can be analysed without any deconvolution operations. The blue line corresponds to a fit of the form factor for monodisperse spheres with a diameter of 600 nm and the green line corresponds to the rocking curve without any sample. The three decades of scattering angles were covered in 5 min (1 second per point).
) and the liquid order (at ultra-low q values). The raw data can be analysed without any deconvolution operations. The blue line corresponds to a fit of the form factor for monodisperse spheres with a diameter of 600 nm and the green line corresponds to the rocking curve without any sample. The three decades of scattering angles were covered in 5 min (1 second per point).


