- Home
- Users & Science
- Scientific Documentation
- ESRF Highlights
- ESRF Highlights 2002
- Soft Condensed Matter
- Structure and Dynamics at the Free Surface of a Liquid Crystal
Structure and Dynamics at the Free Surface of a Liquid Crystal
The liquid crystal state was first observed in 1888 by the Austrian botanist Frederich Reinitzer. Academic interest in liquid crystals grew enormously a decade later once the similarities between the normal-to-superconductor transition and the nematic-to-smectic phase transition were brought to light [1]. A liquid consisting of elongated molecules is said to be in the nematic phase when the molecules are randomly arranged but aligned to point along the same direction. This changes in the smectic A (SmA) phase, where the molecules rearrange into a layered structure with the molecules standing normal to the layers. It is well known that SmA ordered clusters are formed in the nematic phase when the phase transition is approached from above. The size of these clusters is characterised by two correlation lengths  || and
 (|| parallel,
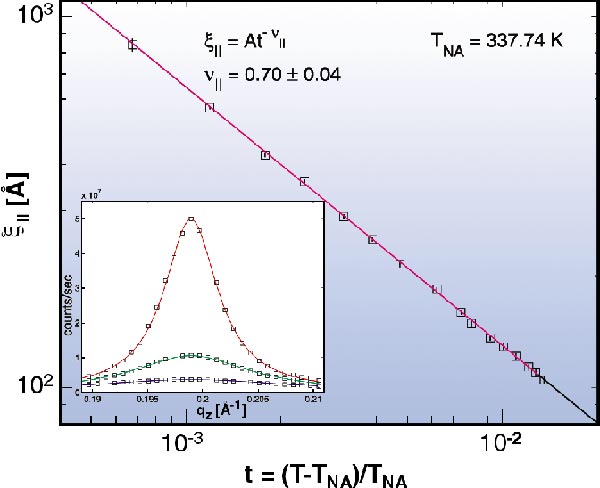
  perpendicular to the molecules). We have probed the SmA ordering at the free surface of the liquid crystal compound 8OCB by X-ray scattering. The experiment was performed at ID10B and the growth of the SmA layering peak upon approaching the phase transition temperature TNA is shown in Figure 19 (inset). From the width of the peak, the correlation length
  || can be extracted as shown in Figure 19. A diverging behaviour
  ||
||  (T/TNA-1)-v|| with critical exponent
  || = 0.70 is evident and the best power-law fit determines TNA = 337.74 K. The second exponent
 is 0.58.
 |
|
Fig. 19: Critical behaviour of the smectic order correlation length |
The structural change from a nematic phase to a layered smectic structure has also consequences for the dynamic properties of the liquid. In the nematic phase the viscosity is anisotropic and one needs three viscosity coefficients  1-3 for its description.
  1-2 remain finite at the N-to-SmA transition while
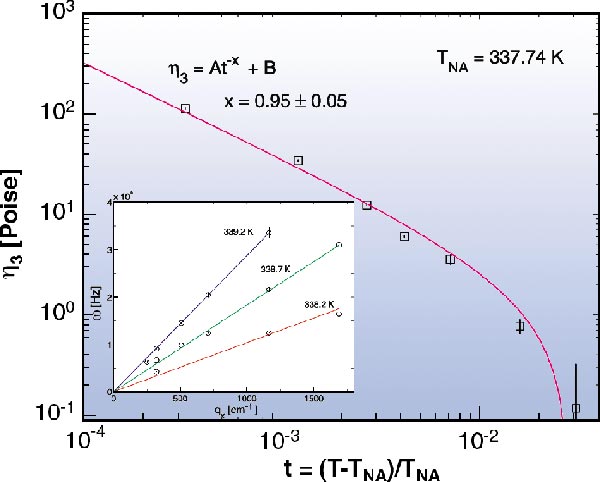
  3 is predicted to show critical behaviour. To verify this we have investigated the free surface of 8OCB by X-ray photon correlation spectroscopy (XPCS) at beamline ID10A, applying a coherent X-ray beam. The surface of a liquid is covered by thermally-activated capillary waves and with XPCS the dispersion relation
  (q) can be measured [2]. The results for 8OCB are shown in Figure 20 (inset) for three different temperatures. In all three cases a linear dependence
  (q)
(q)  q is observed indicating that the capillary wave is over-damped [2]. The viscosity coefficient
  3 can be deduced from the slope of the dispersion relation. The result is plotted in Figure 20 vs. reduced temperature t and a critical, diverging behaviour is apparent. The solid line is a power-law fit to the data yielding a critical exponent of x = 0.95. Previously it was predicted [3] that there is a relation between the dynamic exponent x and the static exponents
  || and
 such that x = 3
 ||-2
||-2
 . Our measurements yield the first experimental evidence for the validity of this relationship.
 |
|
Fig. 20: Critical behaviour of the viscosity coefficient |
In summary, we have used the fact that X-ray scattering can yield information on both the static and the dynamic behaviour of a system to obtain new insight into the connection between structural and dynamic properties at the free surface of a liquid crystal.
References
[1] P.G. de Gennes, Solid State Commun. 10, 753 (1972).
[2] T. Seydel, A. Madsen, M. Tolan, G. Grübel and W. Press, Phys. Rev. B 63, 073409 (2001).
[3] K.A. Hossain, J. Swift, J.-H. Chen and T.C. Lubensky, Phys. Rev. B 19, 432 (1979).
Principal Publication and Authors
A. Madsen (a), J. Als-Nielsen (b) and G. Grübel (a), Phys. Rev. Lett. (2002) in print; A. Madsen (a), B. Struth (a) and G. Grübel (a), to be published.
(a) ESRF
(b) Niels Bohr Institute, University of Copenhagen (Denmark)


