- Home
- Users & Science
- Scientific Documentation
- ESRF Highlights
- ESRF Highlights 2003
- X-ray Imaging
- Synchrotron Radiation CT of Regional Pulmonary Ventilation
Synchrotron Radiation CT of Regional Pulmonary Ventilation
The K-edge Subtraction (KES) method was originally developed for human coronary angiography. Subsequently the method has been used in many other fields of medical imaging. For KES imaging, a contrast agent is introduced into the organ to be imaged, and two simultaneous images are recorded using two X-ray energies that bracket the K-absorption edge of the contrast agent. The difference image in a logarithmic scale yields the distribution of the contrast agent while the signal from the other parts of the object is eliminated.
The KES method has been applied to functional lung imaging of an animal model (rabbit) using the stable Xe gas as the contrast agent [1]. The rabbit is anaesthetised and mechanically ventilated, and methods for fast tomographic imaging were developed. The absolute concentration of the Xe gas could be determined as a function of time within cross-sectional slices of the lung. The time evolution of the concentration follows a simple exponential function, and the time constant ![]() and the specific ventilation (s.V = 1/
and the specific ventilation (s.V = 1/![]() ) can be determined at each individual volume element of the slice. The spatial resolution is 0.1 mm3, which is two orders of magnitude better than the resolution achieved by any other method for lung imaging. Additionally, the noise level of the images is an order of magnitude lower than the noise level achieved by traditional Xe-enhanced CT imaging.
) can be determined at each individual volume element of the slice. The spatial resolution is 0.1 mm3, which is two orders of magnitude better than the resolution achieved by any other method for lung imaging. Additionally, the noise level of the images is an order of magnitude lower than the noise level achieved by traditional Xe-enhanced CT imaging.
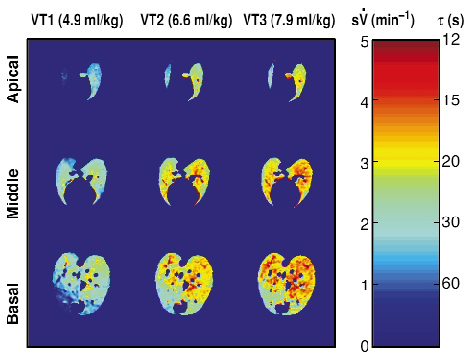
An adequate recruitment of the different lung compartments is an important factor in anaesthesia and intensive care, where mechanical ventilation is used. In the present work the effects of the tidal volume (VT) of inspiration on the ventilation distributions were studied in much greater detail than in previous studies. Overall differences between lung compartments were observed, but the uniformity of ventilation improved in each compartment when VT was increased. A series of ventilation maps is shown in Figure 130. For each slice, the time constants have a log-normal distribution, which is interpreted to arise from the fractal structure of the bronchial tree. The excellent spatial resolution of the KES method with Xe gas as the contrast agent allows studies of the fractal structure over many more generations than has been possible before. This will allow the first measurement of the size of the functional unit of lung ventilation. Future studies are expected to lead to a deeper understanding of the factors affecting ventilation.
 |
|
Fig. 130: Maps of specific ventilation (s.V) and time constant ( |
Reference
[1] S. Bayat et al., Phys. Med. Biol. 46, 3287 (2001).
Principal Publication and Authors
L. Porra (a), S. Monfraix (b,c), G. Berruyer (b), C. Nemoz (b), W. Thomlinson (b,d), P. Suortti (a), A.R.A. Sovijärvi (e), and S. Bayat (b), J Appl. Physiol, in press.
(a) University of Helsinki (Finland)
(b) ESRF
(c) UMR CNRS 5525, Université Joseph Fourier, Grenoble (France)
(d) Canadian Light Source (Canada)
(e) Helsinki University Central Hospital (Finland)


