- Home
- Users & Science
- Scientific Documentation
- ESRF Highlights
- ESRF Highlights 2003
- Materials Science
- Picosecond Crystallography: Myoglobin in Action
Picosecond Crystallography: Myoglobin in Action
Proteins perform their life-giving function dynamically while interacting with other molecules. The ability to watch a protein as it responds to stimuli will help researchers solve many mysteries regarding how it achieves its function. A new step toward that goal was recently taken by a team of scientists working on the time-resolved beamline ID09B, were the first ever movie of a protein executing its function with sub-nanosecond time resolution was produced. The system studied by this team, the oxygen storage protein myoglobin, is similar to hemoglobin but is found in muscle cells rather than blood cells. It supplies oxygen to cells when blood fails to deliver it fast enough (for example, when circulation is blocked during muscle contraction). The aim of the experiment was to identify pathways for oxygen diffusion within the protein and to see how oxygen is finally released into the surrounding solvent. By using CO as a substitute for oxygen, they took advantage of the photosensitivity of the Fe-CO bond, allowing them to trigger ligand release synchronously throughout a crystal by a short laser flash. The mutant L29F of myoglobin [1], in which a leucine residue is replaced by a phenylalanin, proved to be an interesting test case because substantial protein conformational changes take place during the first few hundred picoseconds after laser photolysis.
 |
|
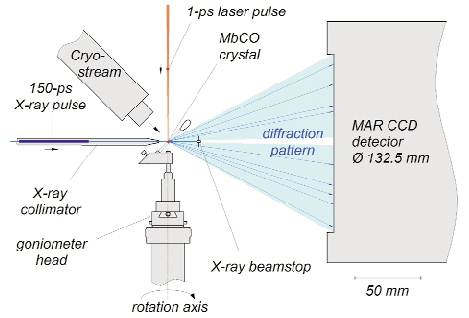
Fig. 60: Experimental setup used to acquire picosecond time-resolved X-ray diffraction data. The crystal is photolysed by a laser pulse and then probed by a time delayed X-ray pulse, whose diffraction pattern is recorded by an area detector. A cooling stream allows the flash photolysis to be repeated at 3.3 Hz. The orientation of the sample is fixed during each exposure; the goniometer spindle rotated between exposures. The 200 µm crystal is mounted in a sealed X-ray capillary. |
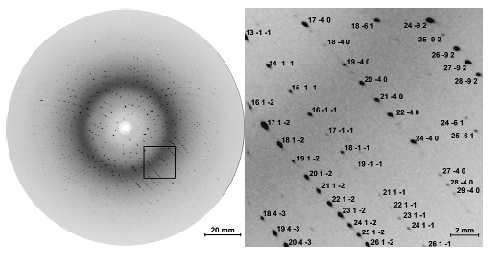
This experiment makes use of the time structure of synchrotron radiation, which consists of 50 to 150 ps long X-ray pulses. The ID09B beamline is equipped with a high-speed chopper capable of isolating single X-ray pulses from the synchrotron pulse train and houses an ultrashort pulsed laser that is synchronized to the X-ray pulses. Time-resolved crystallographic data were acquired using the "pump-probe" technique: the sample was first hit by a laser pulse to trigger the reaction (pump) and then a time-delayed X-ray pulse was scattered off the protein crystal (probe) and its pattern of diffracted X-rays recorded (Figure 60). Since CO rebinds to myoglobin within a few milliseconds, the pump-probe sequence could be repeated on a single myoglobin crystal thousands of times without degradation. To speed up data collection, the unfiltered X-ray beam from an undulator (no monochromator) was used to record polychromatic Laue patterns that contained thousands of reflections at each crystal orientation (Figure 61). The intensity of each reflection is a measure of a Fourier component of the electron density within the unit cell of the crystal. About 20,000 such structure factors were required to calculate, by inverse Fourier transformation, an electron density map with 1.8-Å resolution. By changing the pump-probe delay, the evolution of the electron density as function of time after photolysis was determined.
 |
|
Fig. 61: One of 155 time-resolved Laue diffraction images recorded from a single crystal. This image contains about 3000 diffraction spots. Only a small fraction of these spots would appear when probed with monochromatic X-ray radiation. The enlarged view identifies Miller indices associated with the crystallographic planes that generated the Bragg reflections. This exposure represents the diffracted intensity from 32 X-ray pulses with the laser-to-X-ray delay set to 100 ps, accumulated over 10 seconds. |
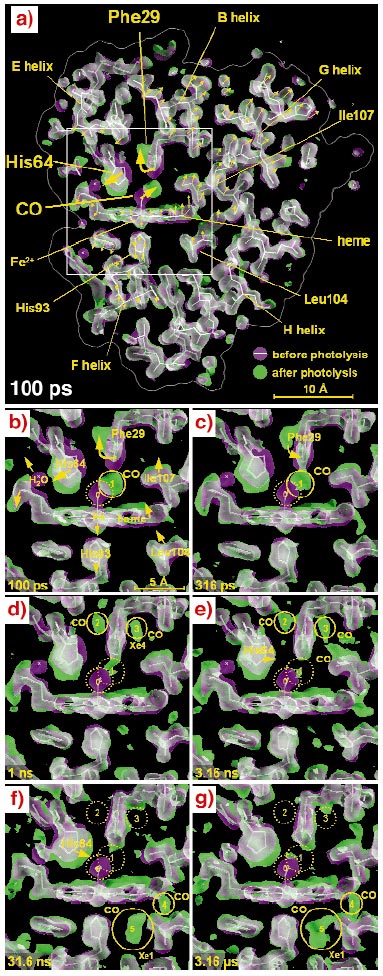
The earliest map, 100 ps after photolysis (Figure 62a), shows that the protein responds promptly to CO dissociation from the iron, revealing distortions spanning across the entire molecule. The time series (Figure 62b-g) suggests a mechanism responsible for the rapid CO expulsion that is characteristic of the L29F mutant. To make room for the free CO, the mutant side chain Phe29 is pushed aside together with the His64. The strain energy stored in this configuration helps drive CO out of its primary docking site on a timescale a thousandfold faster than in wild-type myoglobin. The CO does not immediately escape into the surrounding water from this site, but is still found inside the protein after three microseconds as it migrates through an interconnected web of hydrophobic cavities and seeks an escape channel.
 |
|
Fig. 62: 1.8 Å resolution electron density maps determined at from Laue diffraction data. For clarity, the electron density shown is confined to a 6.5 Å slab through the heme. The photolysed maps are coloured green and the unphotolysed maps are coloured magenta. Where both densities overlap, they blend to white. A white stick model of the unphotolysed structure is included to guide the eye. The direction of molecular motion follows the magenta to green colour gradient. (a) Three large scale displacements near the CO-binding site (large arrows) are accompanied by more subtle correlated rearrangements throughout the entire protein (small arrows; not drawn to scale). (b-g) Enlarged views of the boxed region in panel (a) at time delays specified in the lower left of each panel. (b) Upon photolysis, the bound CO (magenta; site 0) dissociates and becomes trapped approximately 2 Å away in a docking site (green; site 1), close to the Phe29. To accommodate the "docked" CO, the Phe29 is displaced and rotates, pushing His64 outward, which in turn dislodges a bound surface water molecule (magenta). (c-e) From 316 ps to 3.16 ns, the structural changes are largely confined to the vicinity of the binding site. As the CO migrates from site 1 to site 3 (Xe4), the Phe29 and His64 relax toward their deoxy conformations, which are similar to their unphotolysed states. (f-g) By 31.6 ns, CO has migrated to sites 4 and 5, where it remains trapped out to the microsecond time scale. The magenta and green maps were contoured at the same absolute level (1.5 |
Given the level of structural detail obtained with picosecond X-ray crystallography, there is hope that it will contribute to our understanding of protein function at an atomic level.
References
[1] T.E. Carver, R.E. Brantley Jr, E.W. Singleton, R.M. Arduini, M.L. Quillin, G.N. Phillips, J.S. Olson, J. Biol. Chem. 267, 14443-14450 (1992).
Principal Publication and Authors
F. Schotte (a), M. Lim (b), T.A. Jackson (c), A.V. Smirnov (a), J. Soman (d) J.S. Olson (d), G.N. Phillips Jr (e), M. Wulff (f), P.A. Anfinrud (a), Science, 300, 1944-1947 (2003).
(a) National Institutes of Health, Bethesda (USA)
(b) Pusan National University (Korea)
(c) Harvard Medical School (USA)
(d) Rice University, Houston (USA)
(e) University of Wisconsin, Madison (USA)
(f) ESRF


