- Home
- Users & Science
- Scientific Documentation
- ESRF Highlights
- ESRF Highlights 2006
- High Resolution and Resonance Scattering
- Observing the high-frequency limit of sound waves in glasses
Observing the high-frequency limit of sound waves in glasses
Glasses, like all condensed phases, essentially behave as elastic continua for sound waves of sufficiently low frequencies. These can be described by plane waves with well defined wave vector q, related to the angular frequency Ω by Ω = vq, where v is the phase velocity of sound. These waves propagate with an energy mean free path l. Two principal mechanisms produce a finite l in insulating glasses: the relaxation of defects and the anharmonic coupling with modes of the thermal bath, as recently reanalysed in [1]. The question of interest here is what happens at frequencies sufficiently high to probe the intrinsic structural or dynamical inhomogeneities of glasses. Can these produce such a high attenuation that acoustic excitations lose their wavelike character, as suggested by observations of low-temperature thermal conductivities?
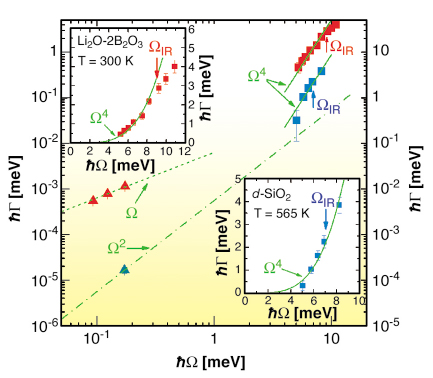
The corresponding frequencies became accessible thanks to Brillouin X-ray scattering on ID16. Figure 3 shows Brillouin linewidths, ![]() = v/l, obtained on two oxide glasses, permanently densified silica (d-SiO2) [2] and lithium diborate (LB2), Li2O-2B2O3. In both cases, a dramatic increase of
= v/l, obtained on two oxide glasses, permanently densified silica (d-SiO2) [2] and lithium diborate (LB2), Li2O-2B2O3. In both cases, a dramatic increase of ![]() , approximately
, approximately ![]()
![]() 4, is observed up to the frequencies
4, is observed up to the frequencies ![]() IR shown by arrows at
IR shown by arrows at ![]() = O/
= O/![]() . The latter implies that l decreased to half the sound wavelength. Thus,
. The latter implies that l decreased to half the sound wavelength. Thus, ![]() IR corresponds to the Ioffe-Regel (IR) crossover beyond which plane waves cease to be a useful concept. One should remark that although similar onsets of crossover are observed for these two glasses at
IR corresponds to the Ioffe-Regel (IR) crossover beyond which plane waves cease to be a useful concept. One should remark that although similar onsets of crossover are observed for these two glasses at ![]() /2
/2![]() in the THz range, the linewidths behave quite differently at lower frequencies. LB2 reveals a
in the THz range, the linewidths behave quite differently at lower frequencies. LB2 reveals a ![]()
![]()
![]() 1 dependence in Brillouin light scattering, characteristic of the thermal relaxation of defects, while d-SiO2 is dominated by anharmonicity, leading to
1 dependence in Brillouin light scattering, characteristic of the thermal relaxation of defects, while d-SiO2 is dominated by anharmonicity, leading to ![]()
![]()
![]() 2 [1].
2 [1].
 |
|
Fig. 3: Brillouin scattering linewidths observed with visible light ( |
It is well known that most glasses also exhibit an excess of modes in their reduced vibrational density of states, Z(![]() )/
)/![]() 2, peaking at a relatively low frequency
2, peaking at a relatively low frequency ![]() BP, called the boson peak. It is remarkable that
BP, called the boson peak. It is remarkable that ![]() IR~
IR~ ![]() BP for the two glasses of Figure 3. This is presumably not an accident. It suggests that the IR-crossover indeed results from the hybridisation of acoustic excitations with excess ones, as recently described in [3]. As shown there, this hybridisation should lead to
BP for the two glasses of Figure 3. This is presumably not an accident. It suggests that the IR-crossover indeed results from the hybridisation of acoustic excitations with excess ones, as recently described in [3]. As shown there, this hybridisation should lead to ![]()
![]()
![]() 4 below
4 below ![]() IR. However, for most glasses,
IR. However, for most glasses, ![]() BP is lower than in the experimentally favourable cases of d-SiO2 and LB2. This generally leads to scattering vectors at the IR-crossover that fall near the lower limit attainable with the current spectrometers. It is thus understandable that the onset region
BP is lower than in the experimentally favourable cases of d-SiO2 and LB2. This generally leads to scattering vectors at the IR-crossover that fall near the lower limit attainable with the current spectrometers. It is thus understandable that the onset region ![]()
![]()
![]() 4 was so far not observed in other glasses. However, there is now sufficient information in the literature to extract good estimates and error bars for
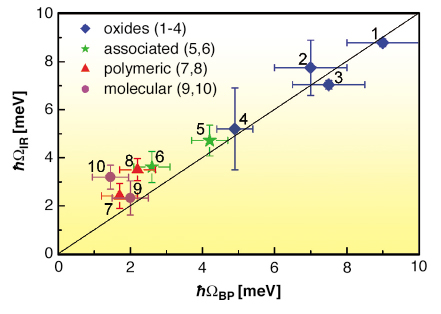
4 was so far not observed in other glasses. However, there is now sufficient information in the literature to extract good estimates and error bars for ![]() IR in a number of cases. These are shown in Figure 4 as a function of
IR in a number of cases. These are shown in Figure 4 as a function of ![]() BP. Values of
BP. Values of ![]() BP are available from various spectroscopy methods, which unfortunately, do not necessarily probe the full Z(
BP are available from various spectroscopy methods, which unfortunately, do not necessarily probe the full Z(![]() ). Hence, average values of
). Hence, average values of ![]() BP have been used in Figure 4. It is remarkable that Figure 4 suggests a relation between
BP have been used in Figure 4. It is remarkable that Figure 4 suggests a relation between ![]() IR and
IR and ![]() BP for all these various glasses, and that those glasses having a strong to intermediate excess of modes seem to obey
BP for all these various glasses, and that those glasses having a strong to intermediate excess of modes seem to obey ![]() IR~
IR~ ![]() BP, in agreement with [3].
BP, in agreement with [3].
 |
|
Fig. 4: Relation between |
References
[1] R. Vacher, E. Courtens, and M. Foret, Phys. Rev. B 72, 214205 (2005).
[2] B. Rufflé, M. Foret, E. Courtens, R. Vacher, and G. Monaco, Phys. Rev. Lett. 90, 095502 (2003).
[3] V.L. Gurevich, D.A. Parshin, and H.R. Schober, Phys. Rev. B 67, 094203 (2003).
Principal Publication and Authors
B. Rufflé (a), G. Guimbretière (a), E. Courtens (a), R. Vacher (a) and G. Monaco (b), Phys. Rev. Lett. 96, 045502 (2006).
(a) LCVN, Université Montpellier 2 and CNRS (France)
(b) ESRF


