- Home
- Users & Science
- Scientific Documentation
- ESRF Highlights
- ESRF Highlights 2009
- Structure of materials
- Looking underneath fullerenes on Au(110): formation of dimples in the substrate
Looking underneath fullerenes on Au(110): formation of dimples in the substrate
Adsorption of organic molecules on metal surfaces can lead to complex nanostructuration of the supporting substrate [1]. The precise atomic and electronic structures of the C60/Au(110) interface have been unveiled by combining synchrotron-based diffraction and spectroscopic techniques with density functional theory (DFT) calculations. Using the experimentally determined structure, DFT shows that the formation of strong directional C-Au bonds arising from the hybridisation between the molecular ![]() orbitals and the surface s metal states. This is the driving force of a massive interface reorganisation that leads to the Au(110)-p(6x5) substrate reconstruction [2] and to the formation of surface nanodimples. The fullerenes are located above these nanodimples, which are one and two layers deep and allow a large increase in the metal/molecule contact area. This new configuration alters the electronic properties of the molecule and substrate system as detected by photoemission (UPS) and inverse photoemission (IPE).
orbitals and the surface s metal states. This is the driving force of a massive interface reorganisation that leads to the Au(110)-p(6x5) substrate reconstruction [2] and to the formation of surface nanodimples. The fullerenes are located above these nanodimples, which are one and two layers deep and allow a large increase in the metal/molecule contact area. This new configuration alters the electronic properties of the molecule and substrate system as detected by photoemission (UPS) and inverse photoemission (IPE).
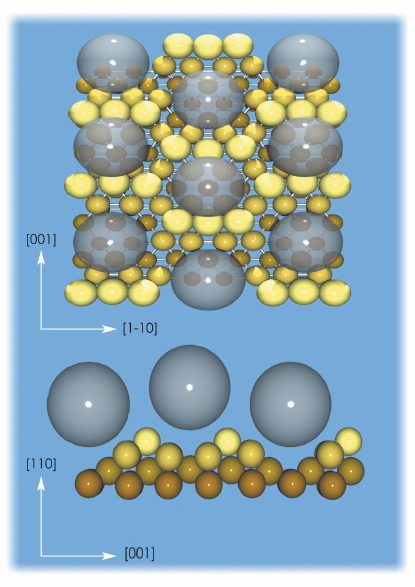
The detailed structure of the C60-substrate interface has been determined by using surface X-ray diffraction (SXRD) at beamline ID03. The structural SXRD analysis was performed on the basis of an extensive data set containing 1096 reflections, specific to the p(6x5) structure. These are reduced to 834 after averaging between the equivalent reflections with symmetry p2mg that form part of 48 fractional-order rods and 8 crystal truncation rods. The resulting surface substrate structure contains two symmetry-independent nanopits, one or two layers deep, where the fullerenes are hosted. Figure 30 shows top and lateral views of the C60/Au(110)-p(6x5) interface structure.
 |
|
Fig. 30: Top and lateral views of the C60/Au/110-p(6x5) interface structure. The transparent spheres simulate the C60 molecules and indicate the absence of preferential orientation. |
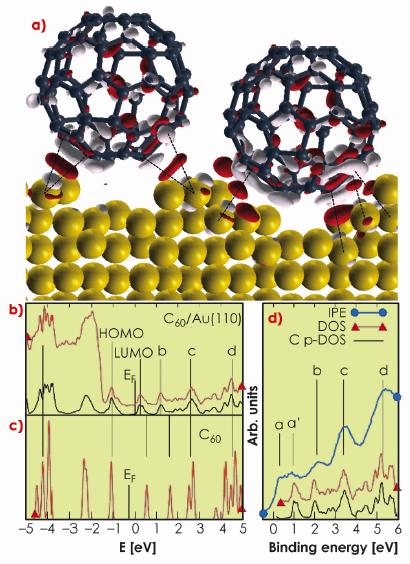
The calculated bonding charge, the density of electronic states (DOS), and the partial DOS (C p-DOS, resulting from projecting the wave functions on the atomic C-2p states) by DFT provide evidence of strong directional C-Au bonding (Figure 31). The bonding charge density is mostly localised between the lateral C atoms in contact with the nanopit edges, while the interstitial region directly underneath the C60 is not primarily involved in bond formation. The degree of directional electronic contribution to the bonding is shown in Figure 31a by charge accumulation (red pockets) localised along the shortest C-Au bond lengths (marked by dashed lines and ranging between 3.1-3.3 Å). Moreover, molecular adsorption induces the polarisation of the C60 molecule, involving mostly the C atoms on the lower half of the molecule.
The photoemission spectrum and the calculated DOS (Figure 31b) do not show any feature between the Fermi level and the C60 HOMO susceptible to be assigned to an ionic contribution to bonding between C and Au atoms. The same conclusion can be drawn from the analysis of the unoccupied states (conduction band inverse photoemission data [3] IPE, and DOS in Figures 31b and 31c). With respect to an isolated C60 molecule (Figure 31c), the LUMO and LUMO+1 states (labelled b) are shifted to lower energies upon adsorption (Figure 31b) but no sizeable fraction of the C60 LUMO is transferred below the Fermi level. The broad feature above the Fermi level in the IPE spectrum (a and a` in Figure 31d) results from two different origins: a flat contribution from the Au s states (a) and the molecular LUMO (a’). At higher energies, the spectrum is dominated by the three distinct molecular peaks (b, c, and d in Figure 31d). The additional charge available after C60 adsorption is redistributed in the contact interfacial region and substrate mass transport takes place in order to form and maximise the number of directional bonds.
 |
|
Fig. 31: a) Bonding charge density obtained from DFT calculation of the structure model of Figure 30, showing positive (red) and negative (light grey) electron density isosurfaces (|0.005| e/Å–3). b) Experimental PE spectrum (red), calculated DOS (black) for C60/Au(110), and c) C p-DOS for an isolated C60 molecule. d) Conduction band IPE data (blue) and C p-DOS (black) for C60/Au(110). |
These results have general implications on the adsorption of large organic molecules on metal surfaces and could lead to the revision of their interaction mechanisms as inferred by STM analysis.
References
[1] R. Felici, M. Pedio, F. Borgatti, S. Iannotta, M. Capozi, G. Ciullo and A. Stierle, Nat. Mater. 4, 688 (2005).
[2] M. Pedio, R. Felici, X. Torrelles, P. Rudolf, M. Capozi, J. Rius, and S. Ferrer, Phys. Rev. Lett. 85, 1040 (2000).
[3] M. Pedio, M.L. Grilli, C. Ottaviani, M. Capozi, C. Quaresima, P. Perfetti, P.A. Thiry, R. Caudano, and P. Rudolf, J. Electron Spectrosc. Relat. Phenom. 76, 405 (1995).
Principal publication and authors
M. Hinterstein (a,b), X. Torrelles (a), R. Felici (c), J. Rius (a), M. Huang (d), S. Fabris (d), H. Fuess (b) and M. Pedio (e), Phys. Rev. B 77, 153412 (2008).
(a) Institut de Ciència de Materials de Barcelona, ICMAB-CSIC (Spain)
(b) Technische Universität Darmstadt (Germany)
(c) ESRF
(d) CNR-INFM DEMOCRITOS National Simulation Center, Grignano, Trieste (Italy)
(e) TASC National Laboratory, INFM-CNR, Trieste (Italy)


