- Home
- Users & Science
- Scientific Documentation
- ESRF Highlights
- ESRF Highlights 2010
- Structural biology
- Diffraction cartography: enhanced sample evaluation and data collection in macromolecular crystallography
Diffraction cartography: enhanced sample evaluation and data collection in macromolecular crystallography
The large multi-component complexes and membrane proteins now routinely studied in Structural Biology tend to produce either very small crystals or crystals that can be extremely heterogeneous in their diffraction properties. The increasing availability of micro-focussed X-ray beams coupled with experimental environments optimised for MX has allowed the design of advanced sample evaluation (mesh scans) and data collection (helical oscillation) protocols. Here we present two examples of how mesh scans can be used in the most challenging projects: searching, within a sample-containing loop, for crystals of maximum dimension of 10 µm using an X-ray beam of 5 µm diameter and selecting the most ordered regions of relatively large crystals using an X-ray beam of 30 µm diameter.
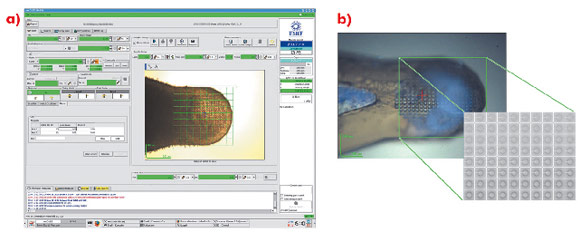
For many projects, particularly those initially producing microcrystals, the rapid identification of crystallisation conditions yielding protein crystals is a considerable advantage. However, locating microcrystals within a large loop is problematic. Lens effects frequently make it difficult to locate small, thin crystals with visible light and the lack of explicit cryoprotection often means that the resulting glass in which microcrystals are contained is opaque. In such cases, the most convenient way to identify both the position and composition of crystals is to use X-ray diffraction coupled with a mesh scan capability. An interface has been implemented within the beamline control GUI MXCuBE [1] based on developments made on beamline ID13. In the sample display area of the GUI, the limits of a grid are drawn and a step size for sampling the grid chosen (Figure 90a). Each position in the grid is associated with a specific coordinate (expressed in the position of the motors phiz (vertical translation of the goniometer axis) and phiy (horizontal translation)) so that the position and diffraction qualities of a previously invisible crystal are recorded (Figure 90b).
In many of the most challenging projects it has proved essential to be able to collect partial diffraction data sets from multiple positions within a crystal and to combine these to produce a complete data set [2]. However, intra-crystal variation in diffraction quality means that it is not always obvious, a priori, from which regions of a crystal partial data sets should be collected. To identify which regions of a crystal will produce the best data, we have developed an automated process combining mesh scans and on-line data analysis with an intuitive presentation of data that systematically defines the most ordered parts of a crystal. We call this process diffraction cartography. The results both map diffraction quality (as determined by EDNA [3]) to different areas of the crystal being studied and define the shape and location of the crystal. Figure 91 shows that diffraction cartography reveals a large variation in predicted data quality across the face of a crystal of bovine F1-ATPase (a large complex, 20 nm in the largest dimension). The results can be projected onto the optical view of the crystal clearly defining crystal shape and position as well as the best volumes for subsequent data collection.
Principal publication and authors
M.W. Bowler (a), M. Guijarro (a), S. Petitdemange (a), I. Baker (a,b), O. Svensson (a), M. Burghammer (a), C. Mueller-Dieckmann (a), E.J. Gordon (a), D. Flot, (a) S.M. McSweeney (a) and G.A. Leonard (a), Acta Cryst. D66, 855-864 (2010).
(a) ESRF
(b) Department of Biology and Biochemistry, University of Bath (UK)
References
[1] J. Gabadinho, A. Beteva, M. Guijarro, V. Rey-Bakaikoa, D. Spruce, M.W. Bowler, S. Brockhauser, D. Flot, E.J. Gordon, D.R. Hall, B. Lavault, A.A. McCarthy, J. McCarthy, E. Mitchell, S. Monaco, C. Mueller-Dieckmann, D. Nurizzo, R.B.G. Ravelli, X. Thibault, M.A. Walsh, G.A. Leonard and S.M. McSweeney. J. Synch. Rad. 17, 700-707 (2010).
[2] T. Warne, M.J. Serrano-Vega, J.G. Baker, R. Moukhametzianov, P.C. Edwards, R. Henderson, A.G. Leslie, C.G. Tate and G.F. Schertler, Nature 454, 486-491 (2008).
[3] M.F. Incardona, G.P. Bourenkov, K. Levik, R.A. Pieritz, A.N. Popov and O. Svensson, J. Synch. Rad. 16, 872-879 (2009).


