- Home
- Users & Science
- Scientific Documentation
- ESRF Highlights
- ESRF Highlights 2012
- Soft condensed matter
- Cytoskeletal network structure studied by X-ray nanodiffraction
Cytoskeletal network structure studied by X-ray nanodiffraction
The cytoskeleton of eukaryotic cells is a complex network of different filamentous biopolymers that gives cells their versatile shapes and specific mechanical properties, and consequently enables cells to perform particular functions. The main constituents of the cytoskeleton are three different classes of fibrous proteins: actin filaments, microtubules and intermediate filaments. These proteins are organised in distinct superstructures such as bundles, networks or networks of bundles. One example of intermediate filaments are cytokeratins, which are expressed in various epithelial cells and provide these cells with the necessary mechanical properties to withstand external stress [1,2]. Cytokeratins assemble via a complex process into filaments with a diameter of about 10 nm and these filaments can further form bundles with diameters up to a few hundreds of nanometres, that are organised in a superstructure.
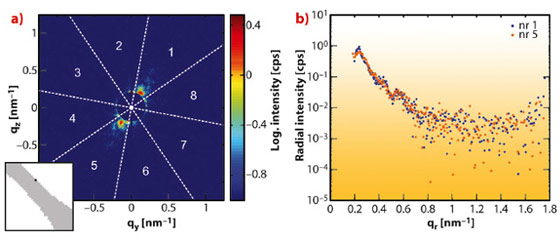
To study the structure of keratin bundles, we performed scanning X-ray diffraction experiments on freeze-dried cells using a nanofocused X-ray beam at beamline ID13. On the one hand, this method allows us to calculate, e.g., the total scattered intensity at each scan point and arrange these values in a two-dimensional array to obtain a so-called X-ray dark-field image of the sample in real-space as shown in Figure 86. On the other hand, we were able to analyse the scattering signal from a small sample volume with dimensions on the order of the beam size and obtain information about the local sample structure as shown in Figure 87.
Figure 86a shows a visible-light fluorescence microscopy image of the keratin network of a group of cells and Figure 86b shows the corresponding X-ray dark-field image of the same sample region. Note that some cells, which are visible in the X-ray dark-field image, do not have a keratin network and are therefore not visible in the fluorescence microscopy image. From the fluorescence microscopy images we selected cells with a pronounced network morphology, like the cell in the centre of Figures 86a and b exhibiting a keratin-rich extension, and performed fine scans with a longer exposure time on smaller sample regions, see Figure 86c. For the fine measurements we not only calculated X-ray dark-field images, but also determined the degree and direction of local sample structure orientation from the anisotropy of the scattering signal in each scattering pattern. In Figure 86c the local structure orientation is indicated by black lines and is depicted as an overlay with the dark-field image. The calculated structure orientation agrees very well with visible structures in the fluorescence microscopy image.
Single scattering patterns were further analysed to determine the local structure in the sample. Here, we integrated the scattered intensity in the azimuthal direction for eight angular segments, as marked by the white lines in Figure 87a. The resulting radial intensity profiles, shown in Figure 87b, exhibit scattering maxima and minima indicating distinct structure in the sample. The employed method therefore allows imaging of the sample in real-space as well as probing the local sample structure using scattering patterns in reciprocal-space, yielding structural information on two different length scales. Furthermore, this technique can be applied to a variety of samples or materials.
Principal publication and authors
B. Weinhausen (a), J.-F. Nolting (a), C. Olendrowitz (a), J. Langfahl-Klabes (a), M. Reynolds (b), T. Salditt (a) and S. Köster (a), New J. Phys. 14, 085013 (2012).
(a) Institute for X-Ray Physics and Courant Research Centre ‘Nano-Spectroscopy and X-Ray Imaging’, Georg-August-Universität Göttingen (Germany)
(b) ESRF
References
[1] H. Herrmann, H. Bär, L. Kreplak, S.V. Strelkov and U. Aebi, Nature Rev. Mol. Cell Biol. 8, 562-573 (2007).
[2] E. Fuchs and D.W. Cleveland, Science 279, 514-519 (1998).


