Figure 42

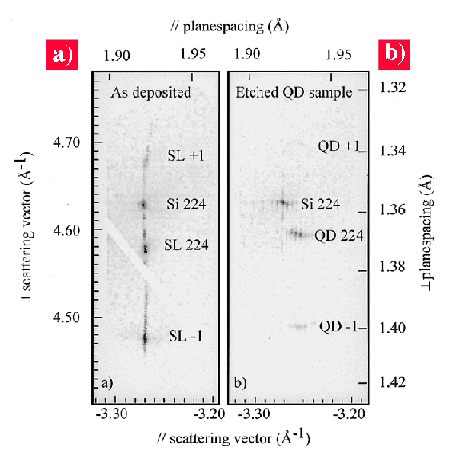
Fig. 42: Overview reciprocal space maps of the region around the 224 reciprocal lattice points showing a clear shift of the layer peaks upon etching. a) and b) show the diffracted intensity distributions from the as-deposited and etched superlattice, respectively. Si denotes the Si-substrate peaks, SL denotes peaks from the as-deposited superlattice, and QD marks the reflections from the quantum dot structure. The order of the superlattice satellite reflections are given by ± 1 in both figures. The left and bottom axes show the scattering vector projected to the directions perpendicular (![]() ) and parallel (//) to the substrate surface. The corresponding lattice parameters are given on the right and top axes.
) and parallel (//) to the substrate surface. The corresponding lattice parameters are given on the right and top axes.


