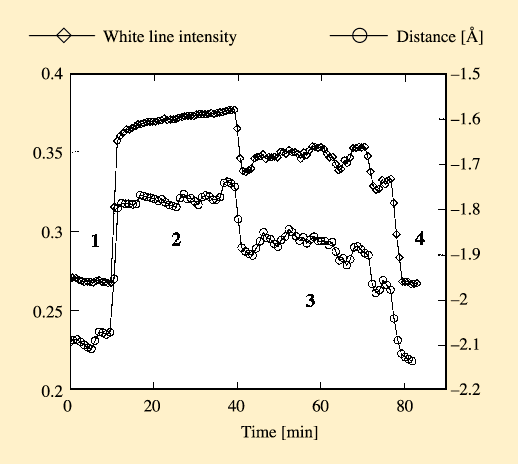
Figure 46

Fig. 46: Intensity of a Lorentzian fitted to the white line (upper curve) and distance variations of the first peak in the Fourier transform of the XFAS signal (lower curve, multiplied by -1). The different states 1 to 4 correspond to reduced, oxidised, active and poisoned catalyst respectively.


