- Home
- Users & Science
- Scientific Documentation
- ESRF Highlights
- ESRF Highlights 2003
- X-ray Imaging
- Reversible Reduction-oxidation Processes in Natural Silicate Melts and Magmas
Reversible Reduction-oxidation Processes in Natural Silicate Melts and Magmas
Iron and sulfur may be considered as the couple of elements buffering the redox state of magmas during their ascent from Earth's mantle to the surface. However, the determination of both the redox state of magmas and the relative variation of the [Fe3+/(Fe3++Fe2+)] atomic ratio is challenging because these magmas evolve, crystallise and lose most of their volatile constituents (H2O, CO2, H2S, SO2, HCl) before being emitted during volcanic eruptions. In addition, the effects of the cooling rate may induce bias in the determination of the redox state of Fe, because of rapid electron exchange. This problem may be addressed by direct in situ measurements of the chemical environment of Fe in silicate melts, as a function of temperature.
Previous micro-X-ray absorption spectroscopy (µXANES) experiments indicated that the energy resolution allows an accurate discrimination between the pre-edge features of Fe2+ (7111.5 eV) and Fe3+ (7113.2 eV) [1]. We provide, here, the first in situ µXANES spectra at the iron K-edge (7130 eV) of H2O-rich silicate glass/melt trapped in natural quartz. The experiments were carried out between 20 and 800°C, using the X-ray Microscopy beamline ID21.
 |
|
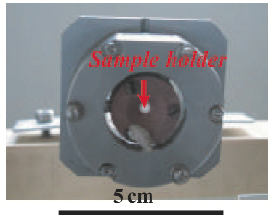
Fig. 139: Water-cooled furnace installed on beamline ID21. |
The crystals were prepared as double face polished, 150 µm thick lamella in order to preserve the inclusion in the centre of the crystals and thus isolated from the surroundings. They were placed in a water-cooled furnace (Figure 139). The different series of µXANES spectra were collected, in transmission mode, on melt/glass inclusions by decreasing the temperature from 800 to 20°C, in steps of 100°C. The energy was scanned between 7050 and 7350 eV, using a fixed-exit Silicon (220) monochromator. The synchrotron X-ray source was demagnified down to a 2x2 µm2 probe by using Fresnel zone-plate lenses [2]. In addition, µXANES spectra were acquired at room temperature on a series of reference Si-rich glasses (~70 wt% SiO2) comparable in composition to the quartz hosted glass inclusions, but with a [Fe3+/![]() Fe)] ratio varying from 0.05 (reduced) to 0.85 (oxidised). New spectra were also done on basaltic reference glasses (~50 wt% SiO2). The centroid energy of the pre-edge position (intensity-weighted average of the each component energy) correlates with the Fe3+/
Fe)] ratio varying from 0.05 (reduced) to 0.85 (oxidised). New spectra were also done on basaltic reference glasses (~50 wt% SiO2). The centroid energy of the pre-edge position (intensity-weighted average of the each component energy) correlates with the Fe3+/![]() Fe ratios in both the Si-rich (rhyolitic) and basaltic glasses. Accordingly, this correlation may apply to a large variety of glass samples from basalt to rhyolite. It is confirmed here that an accurate determination of the redox state of Fe in silicate glasses cannot be retrieved with reference to mineral standards.
Fe ratios in both the Si-rich (rhyolitic) and basaltic glasses. Accordingly, this correlation may apply to a large variety of glass samples from basalt to rhyolite. It is confirmed here that an accurate determination of the redox state of Fe in silicate glasses cannot be retrieved with reference to mineral standards.
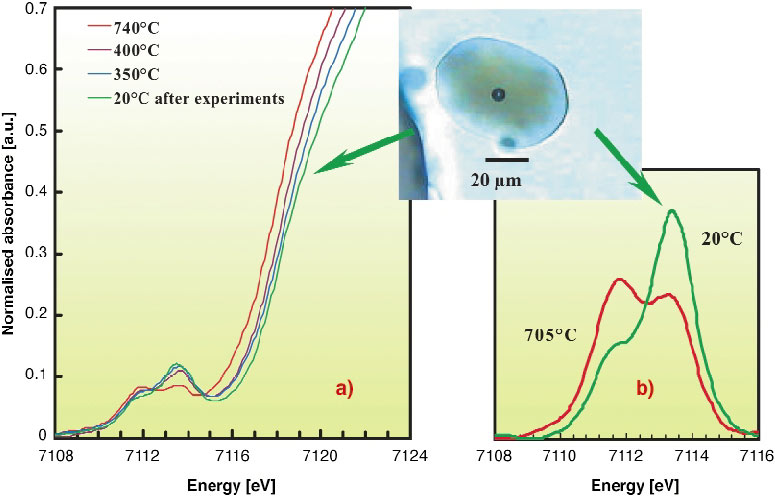
Figure 140a shows that the pre-edge features significantly and progressively evolved towards a reduced state (Fe2+) at high temperature, up to 797°C, and towards the oxidised (Fe3+) pole when cooling down to 20°C. The µXANES spectrum acquired at 20°C, after experiments involving progressive temperature decrease, is illustrated in Figure 140b. It demonstrates the dominance of Fe3+ in the pre-edge structure, a shift of the centroid position by nearly 0.5 eV and an increase in the energy of the main edge compared to high temperature. Similar behaviour was reproduced during different series of experiments. These features clearly reflect iron oxidation in melt. However, cycling experiments with variable cooling rates show that the reduction-oxidation process is reversible. Although hydrogen diffusion through the host quartz crystals along the course of experiments cannot be totally ruled out, the main process would involve the oxygen ions of the silicate melt as donor or receptor of electrons. Such a process would be confirmed by future dispersive energy experiments at the iron K-edge.
 |
|
Fig. 140: (a) In situ micro-XANES spectra at the iron K edge in melt/glass at different temperatures; (b) Pre-edges in melt/glass inclusion at 705°C and 20°C after the series of experiments. The microphotograph illustrates the glass inclusion, at 20°C, after a series of experiments. The contraction bubble appeared during cooling. |
References
[1] Métrich et al. Geophys. Res. Lett. 29/11, doi 10.1029/2001GL014607 (2002) and refs. therein.
[2] Di Fabrizio et al., Nature 401, 895 (1999).
Principal publication and Authors
N. Métrich (a), J. Susini (b), E. Foy (a), D. Massare (a), F. Farges (c), S. Lequien (a), L. Sylla (a), and M. Bonnin-Mosbah (a), submitted to Geochimica et Cosmochimica Acta.
(a) CNRS-CEA, CE-Saclay, Gif sur Yvette (France)
(b) ESRF
(c) Université de Marne La Vallée (France)


