- Home
- Users & Science
- Scientific Documentation
- ESRF Highlights
- ESRF Highlights 2006
- Soft Condensed Matter
- Phase diagram of a solution undergoing inverse melting
Phase diagram of a solution undergoing inverse melting
The phenomenon of inverse melting happens when a liquid heated at constant pressure undergoes a reversible liquid-to-crystal transition [1,2]. Such a transition of endothermic nature implies the passage from a low-temperature liquid (LTL) to a high-temperature crystal (HTC) with absorption of heat. This behaviour, which is the opposite to what is expected for common liquids, indicates the presence of a crystal with entropy higher than its liquid counterpart. On further heating, the HTC may eventually melt into a high temperature liquid (HTL).
Using differential scanning calorimetry (DSC) and X-ray diffraction methods we have investigated the phase diagram of a system belonging to this class of materials, a solution of ![]() -cyclodextrin (
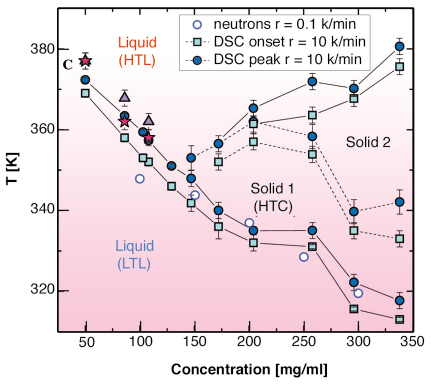
-cyclodextrin (![]() CD) (C36H60O30), water and 4-methylpyridine (4MP) (C6H7N) [3]. DSC measurements were performed to determine and characterise the inverse phase transitions from an energetic point of view. The measurements of heat absorption as a function of the temperature show peaks of endothermic nature. In Figure 59 the temperature of the peak (Tpeak) and of the onset (Tonset) are reported as full circles and squares respectively.
CD) (C36H60O30), water and 4-methylpyridine (4MP) (C6H7N) [3]. DSC measurements were performed to determine and characterise the inverse phase transitions from an energetic point of view. The measurements of heat absorption as a function of the temperature show peaks of endothermic nature. In Figure 59 the temperature of the peak (Tpeak) and of the onset (Tonset) are reported as full circles and squares respectively.
 |
|
Fig. 59: Phase diagram of |
In the concentration region 150-350 mg/ml of ![]() CD-in 4MP three endothermic transitions are observed on increasing the temperature: the first corresponds to the LTL-HTC, the second has been associated to a solid-solid transition, the third corresponds to the HTC-HTL transition. At decreasing
CD-in 4MP three endothermic transitions are observed on increasing the temperature: the first corresponds to the LTL-HTC, the second has been associated to a solid-solid transition, the third corresponds to the HTC-HTL transition. At decreasing ![]() CD concentration, in the region 50-150 mg/ml, the solid region becomes thinner until it disappears and single endothermic transition peak is observed. This experimental observation is compatible with a direct LTL-HTL transition.
CD concentration, in the region 50-150 mg/ml, the solid region becomes thinner until it disappears and single endothermic transition peak is observed. This experimental observation is compatible with a direct LTL-HTL transition.
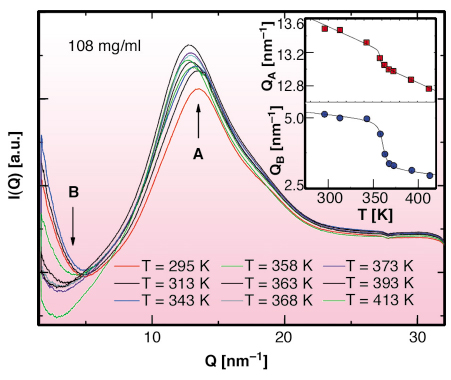
In order to give a microscopic interpretation of the behaviour of the liquid and to investigate its local structure in the low concentration region, an X-ray diffraction experiment was performed as a function of the temperature along the LTL-HTL transition on the beamline BM29. Three different concentrations of ![]() CD in 4MP have been investigated. An example of the integrated scattered intensity I(Q) at the concentration 108 mg/ml and in the temperature range 295 to 413K is reported in Figure 60. It confirms the existence of a disordered structure both below and above the transition temperature detected by DSC. The temperature evolution of the structure of the liquid has been followed looking at the Q position of the first maximum (around Q = 13 nm-1) and minimum (around Q = 4 nm-1) of the I(Q) respectively identified as positions QA and QB. The Q values of these two points reported as a function of temperature in the insets of Figure 60 show a jump at the temperatures corresponding to the LTL-HTL transition, as derived by the DSC measurements. The three transition temperatures for the maxima (full triangle) and the minima (full stars) of I(Q) reported on the phase diagram of Figure 59 show a good agreement.
CD in 4MP have been investigated. An example of the integrated scattered intensity I(Q) at the concentration 108 mg/ml and in the temperature range 295 to 413K is reported in Figure 60. It confirms the existence of a disordered structure both below and above the transition temperature detected by DSC. The temperature evolution of the structure of the liquid has been followed looking at the Q position of the first maximum (around Q = 13 nm-1) and minimum (around Q = 4 nm-1) of the I(Q) respectively identified as positions QA and QB. The Q values of these two points reported as a function of temperature in the insets of Figure 60 show a jump at the temperatures corresponding to the LTL-HTL transition, as derived by the DSC measurements. The three transition temperatures for the maxima (full triangle) and the minima (full stars) of I(Q) reported on the phase diagram of Figure 59 show a good agreement.
 |
|
Fig. 60: Integrated scattered intensity from a solution of |
The combination of DSC and X-ray diffraction allowed us to draw the phase diagram of a solution undergoing inverse melting and to characterise the microscopic local different structure of the two disordered liquid phases, the LTL and the HTL, observed in the low concentration region.
References
[1] A. Lindsay Greer, Nature 404, 134 (2000).
[2] A. Crisanti and L. Leuzzi, Phys. Rev. Lett. 95, 087201 (2005) and references within.
[3] M. Plazanet , C. Floare, M.R. Johnson, R. Schweins, and H.P. Trommsdroff, J. Chem. Phys. 121, 5031 (2004).
Principal Publication and Authors
R. Angelini (a), G. Ruocco (a,b), S. De Panfilis (c), F. Sette (c), submitted.
(a) CRS SOFT- INFM-CNR, Università “La Sapienza”, Roma (Italy)
(b) Dipartimento di Fisica, Università “La Sapienza”, Roma (Italy)
(c) ESRF
partners


European Synchrotron Radiation Facility - 71, avenue des Martyrs, CS 40220, 38043 Grenoble Cedex 9, France.