- Home
- News
- Spotlight on Science
- Nanodiffraction...
Nanodiffraction imaging of impurities in atomised particles
08-01-2015
Nano X-ray diffraction computed tomography (XRD-CT) at the ESRF has been used to image the microstructure of UMo alloy atomised particles at the nanoscale. The results show that carbide impurities form during the solidification of these particles and play an important role in the UMo grain microstructure development. This new information will help optimise the manufacturing process.
Despite their low concentration, impurities in materials are often important since their behaviour can dramatically modify the physical properties of the whole material. X-ray diffraction tomography techniques with high spatial resolution have recently been developed for the 2D or even 3D characterisation of materials [1, 2]. However, the application of these methods is often restricted to samples with specific microstructures: diffraction based grain imaging (3D-XRD) works well on materials with coarse grains (larger than 5-10 µm) [2], while XRD-CT, a powder diffraction based method, is well suited for multi-phase materials with very small grains [1] (which can be in the 10 nm range if sub-micrometre resolution is needed in the reconstruction). In this study, we show that a new method derived from XRD-CT can be used to image the microstructure of multi-phase “real” materials with grain size in the intermediate 10 nm to 10 µm range. In addition to mapping all crystallographic phases, the orientation of each grain was also reconstructed.
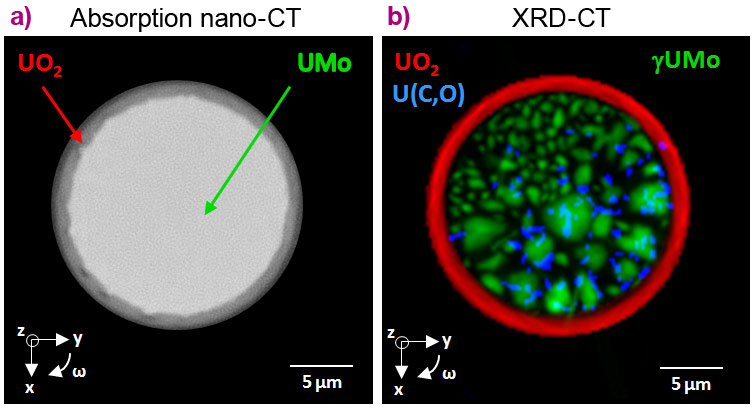
The samples were spherical UMo particles produced by centrifugal atomisation; these particles are regarded as low enriched nuclear fuels for the most powerful research reactors. Many in-reactor tests have been performed worldwide during the past fifteen years, suggesting that for higher efficiency, these particles should be coated with a thin anti-diffusion barrier, and that the UMo grain size needs to be controlled (and possibly increased). The first step in this engineering process is to characterise the microstructure of an as-produced UMo particle including the location of the most abundant (1 wt%) impurity phase U(C,O). The particle selected here had a diameter of 20 µm (see Figure 1) and was protected by a 1 µm UO2 anti-diffusion layer (see Figure 2a) [3].
 |
|
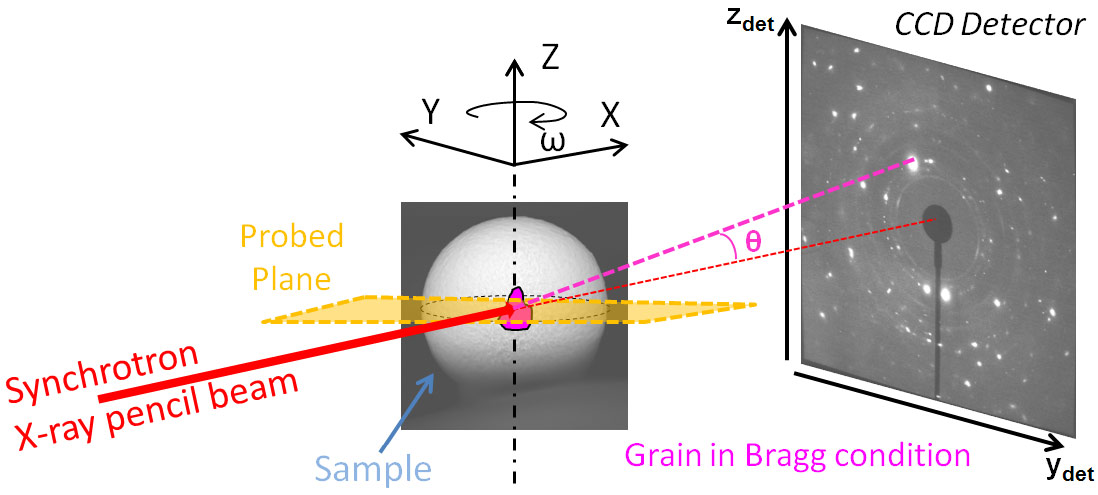
Figure 1. Schematic representation of the XRD-CT acquisition setup used at ID22NI beamline (now ID16b). An image obtained by scanning electron microscopy of the analysed UMo atomised particle is used to show sample location. During an XRD-CT measurement, the sample is scanned horizontally (y axis) in the focal plane for each tomographic angle ω. This implies the acquisition of Ny×Nω diffraction patterns, Ny and Nω being the number of steps chosen for the scan along y and ω respectively. |
A single XRD-CT data set was collected in the equatorial plane with a 0.2 µm spatial resolution using the hard X-ray nanoprobe installed at the ID22NI beamline (now ID16B, see Figure 1). Conventional XRD-CT data treatment was first performed to account for powder rings originating from the UO2 grains in the outer layer (~10 nm). For the larger UMo grains (1-7 µm) and for the smaller (0.2-1 µm) U(C,O) grains, both in the core of the particle, a novel data processing method was used which is based on indexing the diffraction spots. Figure 2b shows the reconstructed slice of this particle as obtained by XRD-CT.
 |
|
Figure 2. Results of the X-ray tomography experiment performed at the equatorial plane on an atomised UMo particle (diameter about 20 µm). a) Absorption computed tomography with a 0.05 µm resolution (Nano-CT). b) Combined results of the XRD-CT analysis with a 0.2 µm resolution. |
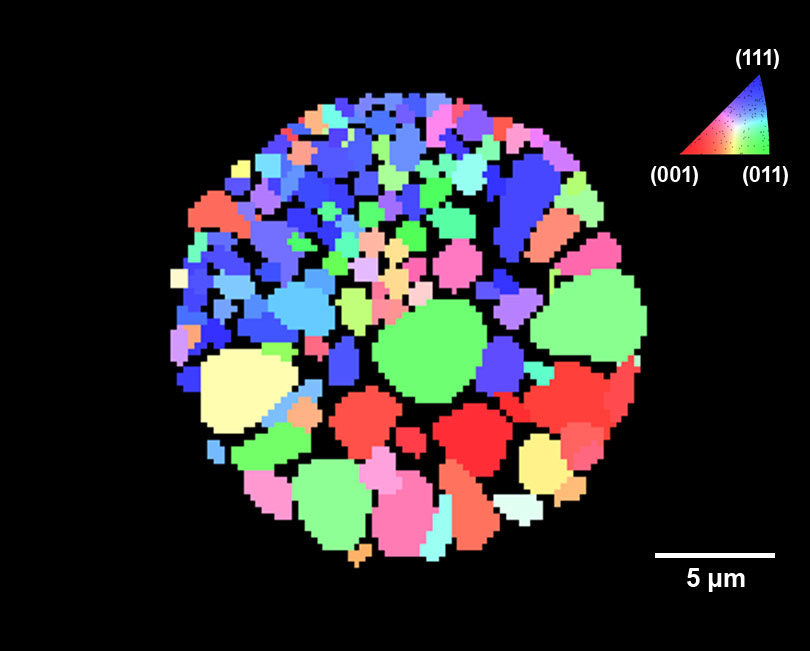
Strong variability in the UMo grain size was observed for grains located inside the particle. For example, there were many small grains on one side of the particle with similar orientation (see Figure 3). To check whether U(C,O) grains could have acted as nucleation sites for the larger UMo grains during solidification, crystallographic relationships between neighbouring U(C,O) and UMo grains have been checked. It was found that lattices of both phases are related by a 45° rotation angle between them and share a common axis. However, several U(C,O) grains (up to 6) were found on or inside a single UMo grain. This suggests that U(C,O) does not act as a nucleation site for UMo grains but rather that U(C,O) forms during UMo grain solidification and growth. A lower density of U(C,O) grains in the vicinity of the smaller UMo grains can be seen in Figure 2b. We do not know whether this implies a lower U(C,O) concentration in this area or whether undetectably small U(C,O) grains are formed with characteristics below the detection limit (0.05 µm).
 |
|
Figure 3. UMo grain orientation map with colours defined in the inset (conventional RGB colours as used for inverse pole figures). |
Further work is required to understand the reason why there are UMo grains with very different size within the same particle slice. Solidification in such small spherical particles was thought to be very fast and homogenous. In view of the highly anisotropic microstructure observed here, this assumption must be questioned.
Principal publication and authors
Impurity precipitation in atomized particles evidenced by nano x-ray diffraction computed tomography, A. Bonnin (a,b,c), J.P. Wright (a), R. Tucoulou (a), H. Palancher (b), Appl. Phys. Lett. 105, 084103 (2014).
(a) ESRF
(b) CEA, DEN, DEC, St. Paul Lez Durance (France)
(c) Present address: SLS, Paul Scherrer Institut, Villigen (Switzerland)
References
[1] P. Bleuet, E. Welcomme, E. Dooryhee, J. Susini, J.-L. Hodeau, and P. Walter, Nat. Mater. 7, 468–473 (2008).
[2] H.F. Poulsen, Three-dimensional X-ray diffraction microscopy: mapping polycrystals and their dynamics, Springer Tracts in Modern Physics 205, p. XI (2004).
[3] H. Palancher, A. Bonnin, V. Honkimäki, H. Suhonen, P. Cloetens, T. Zweifel, R. Tucoulou, A. Rack, and M. Voltolini, J. Appl.Crystallogr. 45, 906–913 (2012).
Top image: Image of an atomised UMo alloy particle, with UMo grains in green and U(C,O) impurities in blue. Combined results of an XRD-CT analysis with a 0.2 µm resolution.
partners


European Synchrotron Radiation Facility - 71, avenue des Martyrs, CS 40220, 38043 Grenoble Cedex 9, France.