- Home
- Users & Science
- Find a beamline
- Collaborating research group beamlines
- BM32 - IF - InterFace Beamline, French CRG
- BM 32 Featured Articles
- Fe/MgO/Fe(001) magnetic tunnel junctions
Fe/MgO/Fe(001) magnetic tunnel junctions
Oxygen induced symmetrization and structural coherency of Fe/MgO/Fe(001) magnetic tunnel junctions (MTJ)
C. Tusche, H.L. Meyerheim, N. Jedrecy, G. Renaud, A. Ernst, J. Henk, P. Bruno, and J. Kirschner
Large tunnel magnetoresistance values up to several 1000% were predicted theoretically on the basis of model structures involving abrupt Fe-MgO interfaces. The decisive role of the atomic structure on the tunneling properties was proven in recent studies on resonant tunneling through interface states involving minority channel conductance and by the observation of an asymmetric bias dependence. The latter was tentatively attributed to asymmetric interface structures. The assumption of different interface structures is doubly justified. First, the growth of Fe on MgO is different from MgO growth on Fe due to the different surface free energies of MgO (1.1 J/m2) and Fe (2.9 J/m2). Layer-by-layer growth is favored for MgO on Fe but not vice versa. Second, experimental evidence, was given for an FeO-interface layer between the Fe(001) bottom electrode and the MgO-barrier. Recent calculations have shown that the FeO-interface layer reduces the TMR-effect by reducing the coupling of the 1-state between the Fe-and the MgO-layer.
Despite evidence of the key-role played by the atomic structure on the TMR effect, no crystallographic analysis of a complete MTJ structure as well as its dependence on the preparation conditions has been carried out thus far. To this end we present a surface x-ray diffraction (SXRD) study on differently prepared Fe/MgO/Fe(001) MTJ’s.
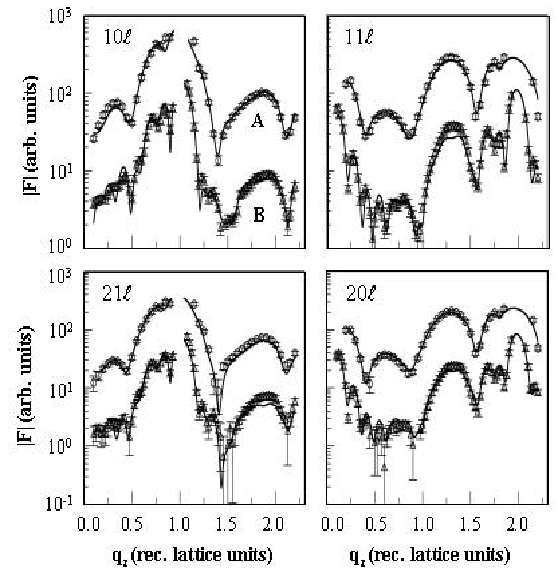 |
Fig 1 : Measured (symbols) and fitted (lines) distribution of the structure factor amplitude (|F|) along the (10), (11), (20) and (21) CTR’s. Circles and triangles represent data collected for sample (A) (UHV deposition of top Fe-electrode) and (B) (oxygen assisted deposition), respectively. Curves are shifted vertically for clarity. |
The samples were prepared as follows: First, a two mono-layer (ML) thick MgO-layer was deposited under ultra-high vacuum (UHV) conditions (base pressure 10-10 mbar) on the atomically clean monocrystalline Fe(001) electrode crystal followed by deposition (deposition rate: 0.25ML/min.) of an eight ML thick Fe-film using molecular beam epitaxy (MBE). For the top Fe-layer deposition, two kinds of preparations were used: In the first, the upper Fe-film was deposited under UHV conditions. In the second, Fe-deposition was carried out under 10-7 mbar ambient oxygen pressure up to 0.5ML coverage. At this point the oxygen exposure was stopped and Fe-deposition was continued under UHV conditions. In the following we call the samples (A) for UHV deposition and (B) for oxygen assisted deposition.
 |
|
|
Fig. 2: SXRD derived concentration profiles for sample A (a) and B (b). Blue and yellow bars represent Fe and Mg, respectively. Superimposed hatched areas (red) represent oxygen. Labels indicate the element concentration in percent of a ML. |

Integrated x-ray reflections were collected at grazing incidence of the incoming beam (=0.68 Å) along four symmetry independent [(10), (11), (20) and (21)] crystal truncation rods (CTR’s). Fig. (1) shows the structure factor amplitudes (|F|) measured up to qz=3.53 Å-1. Circles and triangles represent data points collected for samples (A) and (B), respectively. Standard deviations () represented by error bars were derived from the counting statistics and the reproducibility of symmetry equivalent reflections. In general, these were found to be in the 7% range.
As compared to the CTR’s of sample (A), those of sample (B) are considerably more structured. This can directly be interpreted that in the latter case more layers contribute to the total scattering amplitude. The quantitative analysis is carried out by least square refinement of the |F|’ s calculated for a model structure to the measured ones. Due to the high (mm4) site symmetry of the atomic positions within the surface unit cell [(x,y) either at (0,0) or (½, ½ )] only the z-position and site occupancy needs to be varied in each layer. Complete Fe and MgO layers are described by one Fe and by one Mg- and O-atom within the surface unit cell, respectively. Occupancy factors for the different atomic species below 1.0 represent incomplete layers. In addition to the MgO-and the top Fe-electrode layers, we also included the two uppermost substrate Fe-layers into the refinement. Taking account of deeper layers did not lead to better fits.
 |
Fig 3: Atomic model of the near-interface structure in sample (B). Blue balls correspond to Fe-atoms, red and yellow balls to O- and Mg-atoms, respectively. Distances are given in Ångstroem units. |
Direct eye inspection indicates that all details of the experimental curves are almost perfectly reproduced. This is expressed by the un-weighted residual (Ru) in the 10% range, which for SXRD studies and the complexity of the samples is an excellent value.
We find a total coverage of 2.3 ML MgO for both samples due to some overdosing. From STM images it is known that MgO-islands grow above a complete second MgO-layer.
Significant differences between samples (A) and (B) exist for the subsequently grown parts of the MTJ. Most importantly, for sample (A) only 1.1ML Fe contributes to the SXRD signal although 7.8 ML were deposited. It is concluded that the remaining Fe (6.7 ML) is not in registry with the underlying crystal lattice. In contrast, for sample (B) the total amount of deposited Fe contributes to the SXRD data indicating a high degree of structural order throughout the whole MTJ. Layer-by layer growth is perfect for the first five Fe-layers but subsequently deposited layers are not complete, indicating the tendency to form three-dimensional islands (see fig. 2b). The different growth behavior of Fe in (A) and (B) is attributed to the fact that oxygen supply during the initial Fe-growth as in the case of sample (B) leads to the formation of a complete FeOx-layer above the MgO-spacer serving as a template for successive Fe-growth.
A pictorial view of the interface structure in sample (B) is shown in fig. (3). Blue balls represent Fe-atoms, Mg-and O-atoms are represented by yellow and red balls, respectively. Interlayer distances given in Å units are indicated on the left (error 0.10 Å). Interfacial O-atoms are randomly distributed within the FeOx-layer, since no superstructure is observed. There is an enhanced interlayer spacing between the FeOx-and the adjacent Fe-layers (1.68 and 1.77 Å), corresponding to an 18 and 23% expansion relative to the Fe bulk spacing (1.43 Å). Expansions rapidly damp out away from the interface and only the second layer distance is expanded (1.48 Å and 1.58 Å). There is some rumpling within the FeOx-layers, where the O-atoms are located 0.12 Å above (bottom interface) and 0.26 Å below (top interface) the Fe-position. Due to the lateral 3.7% compression of the MgO-layer to adapt to the Fe-lattice (bulk lattice constant: 4.21 Å versus 4.05 Å for Fe), the MgO-layers are tetragonally expanded, however the determined value of 14% is larger than expected by continuum elasticity theory (3%), possibly due to the interaction with the FeOx-interface.
Oxygen assisted growth of a coherent MTJ is directly related to the presence of a symmetric interface characterized by complete FeOx-layers at both interfaces. Lack of registry of the top Fe-electrode in sample (A) has considerable impact on the propagation of the Bloch states from the MgO-layer into the Fe-electrode, since coherent tunneling conserving parallel momentum (k), is not possible in this case and might explain large differences between theoretical and experimental TMR values.
Our structural study has proven the delicate dependence of the tunneling properties on the structural details of the MTJ, emphasizing the importance of precise knowledge of the interface structure and the crystallographic order. Oxygen assisted symmetrization of the MTJ involving two FeO-interface layers and leading to a fully coherent MTJ is a key property for achieving giant TMR values required for technological applications.
partners


European Synchrotron Radiation Facility - 71, avenue des Martyrs, CS 40220, 38043 Grenoble Cedex 9, France.