- Home
- Users & Science
- Scientific Documentation
- ESRF Highlights
- ESRF Highlights 2002
- Surface and Interface Science
- Liquid Order at a Solid-liquid Interface
Liquid Order at a Solid-liquid Interface
In all the areas where one encounters solid-liquid interfaces, e.g. crystal growth, lubrication, catalysis and electrochemistry, a proper understanding of the physical and chemical phenomena requires structural knowledge of the interface at an atomic scale. For a long time suitable experimental techniques were not available and the main ideas were derived from theoretical models. Such studies show that a liquid at the interface of a crystal exhibits crystal-induced ordering in the first three to four layers. The ordering is predicted to be strongest in the perpendicular direction (layering). Using the intense and high-energy X-ray beams that are available at the ESRF one can now determine this ordering experimentally from surface X-ray diffraction (SXRD) data.
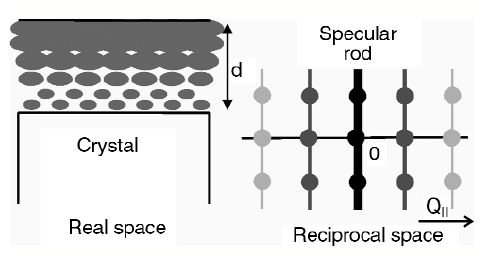
SXRD probes the atomic structure of an interface by measuring diffracted intensities along so-called crystal truncation rods (CTRs) [1]. These rods are tails of diffuse intensity connecting the bulk Bragg peaks in the direction perpendicular to the surface (Figure 27). Their exact shape is determined by the interface atomic structure. A partly-ordered liquid at the interface will contribute to the diffraction signal from the substrate with a magnitude that depends on the ordering. If the liquid layer is completely disordered parallel to the interface, it only contributes to the specular rod (labelled as the (00)-rod) it does not contribute to rods with an in-plane momentum transfer. If the liquid layer at the interface is partially ordered owing to the periodic potential of the surface, it contributes most strongly to rods with small in-plane momentum transfer. Thus, the amount of ordering in the liquid can be determined by measuring various rods with different in-plane momentum transfer. Figure 27 shows a schematic drawing of a crystal covered with a partly-ordered liquid layer and of the varying contribution of the ordered liquid to the different rods in reciprocal space.
 |
|
Fig. 27: Schematic drawing of a crystal covered with a partly-ordered liquid layer of thickness d. The contribution of the (partially) ordered liquid to the substrate diffraction rods is strongest in the specular rod and diminishes at higher parallel momentum transfer (Q||) in reciprocal space. |
The interface structure of KDP (potassium-dihydrogen-phosphate, KH2PO4) crystals with water was measured [2] on beamlines ID3 and ID32. KDP crystals can be grown with high quality and are technologically important, e.g. in laser systems for harmonic generation and opto-electrical switching. Grown from aqueous solution, two different faces are observed on the morphology of KDP crystals, the {101} and {100} face. The surface structure of the {101} face was found previously to terminate in a potassium layer [3].
Such measurements are not easy because the modulation due to the liquid is weak, while the signal-to-background ratio is poor much poorer than data taken from a crystal in vacuum because the liquid gives a strong background. For this reason the reported results to date concern mainly the layering of the liquid perpendicular to the surface, as derived from the specular rod [4]. In order to measure the lateral ordering components as well, one needs to reduce the background as much as possible. One way to achieve this is to use ultra-thin water layers. AFM and ellipsometry measurements indicate that in a humid environment KDP crystals are covered with such an ultra-thin water layer. It is possible to control the thickness of the water layer using a temperature-controlled 'environment cell' in which the relative humidity can be set to 100%.
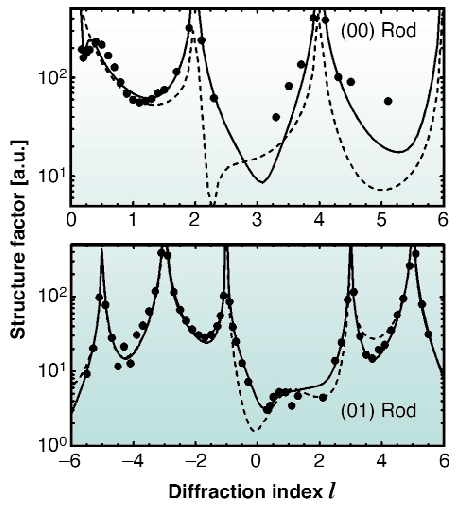
Extensive data sets were measured under a variety of conditions. An example showing two rods is presented in Figure 28, for data obtained at 45°C. An indication of the effect of the ordering of the liquid layer on the diffracted intensity is obtained by comparing the measured structure factors with the ones calculated using the earlier model (dashed curves), in which the effects of the liquid were ignored. As expected, large differences were found for the specular rod and smaller differences for the (10) rod, indicating ordering in the water layer.
 |
|
Fig. 28: The data for the (00) (= specular) and (10) crystal truncation rods, plotted as a function of l. The solid line is the best fit using the model described in the text. The dashed line is calculated using a model that ignores the water layer. |
In order to determine the structure of the liquid, a model is needed that describes all features of the interface shown in Figure 27. Thus the model must contain a crystalline part describing the KDP crystal surface and a liquid part describing both the ordering properties as well as the thickness of the water layer. A potassium terminated KDP surface is used to model the crystalline part. The liquid part of the interface is modelled with planes of oxygen atoms parallel to the surface. Oxygen atoms are used instead of water molecules because X-rays are largely insensitive to hydrogen atoms. The strength of the ordering of each layer is fitted through anisotropic Debye-Waller parameters for the oxygen atoms. A small in-plane Debye-Waller parameter corresponds to a layer with high lateral ordering that will contribute to all rods. Bulk liquid layers that only contribute to the specular rod, are modelled by giving these a large in-plane Debye-Waller parameter (>1000). As demonstrated by the solid curves in Figure 28, the model describes the data well, including the Kiessig fringe near l = 0.4 of the (00)-rod that shows that the total liquid film thickness is 22 Å.
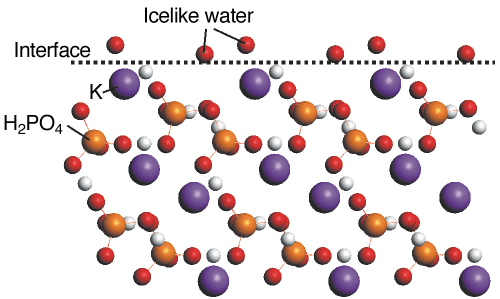
The structure of the crystalline part fully agrees with that found earlier. Somewhat surprisingly, we find the first two water layers near the crystal surface to be well-ordered. Subsequent layers rapidly loose their order; the third layer has both lateral and perpendicular order, the fourth layer only perpendicular. Figure 29 shows the interface structure including the two well-ordered water layers. The two atoms are in close contact with the topmost crystal layer, with which the atoms apparently have quite a strong interaction. Our data show that these layers show a more ice-like than liquid-like behaviour.
 |
|
Fig. 29: Schematic side view of the KDP {101} surface, including the two well-ordered water layers represented by O atoms. The first O layer is located close to the extrapolated position of a next K layer. |
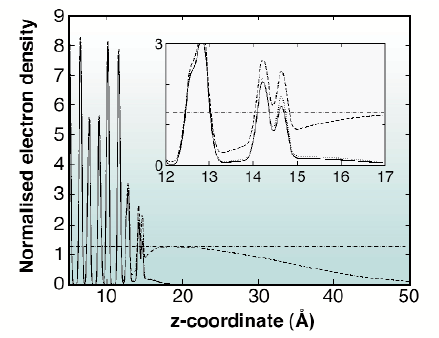
A convenient way to visualise the results is with a projection of the electron density distribution on the z-axis. The in-plane order of the water layer can be taken into account using an additional term in the density distribution depending on the in-plane momentum transfer and in-plane Debye-Waller parameters. The electron density distribution for the specular rod is the 'genuine' distribution, including the diffuse part of the liquid layer. The profile for the other rods shows the part of the electron density that corresponds to this particular Fourier component in the liquid. Figure 30 shows the electron density profiles across the interface. The double peak at 14-15 Å corresponds to the oxygen atoms. In all cases, we see the two well-ordered oxygen peaks near the surface. The (10) and (20) profiles show in addition a weak contribution from the third water layer. The density for the (00) rod clearly shows the entire diffuse water layer with a density close to that of a saturated solution, as expected.
 |
|
Fig. 30: Electron density distribution across the interface. The electron density is normalised to the electron density of water. The density distribution is shown for three parallel momentum transfers, (00) (dashed line), (10) (dotted line) and (20) (solid line). In addition, the dash-dotted line gives the electron density of a saturated KDP solution. The double peak at 14.5 Å represents the ice-like layer. |
In general, the observations agree with earlier theoretical studies that predicted a stronger perpendicular than lateral ordering. The highly ordered first two water layers were unexpected for this crystal in contact with its growth solution. These layers must arise from the strong interactions with the ionic surface, similar to the hydration layers around isolated ions, and deserve further theoretical investigation.
References
[1] I.K. Robinson, Phys. Rev. B 33, 3830-3836 (1986).
[2] M.F. Reedijk, J. Arsic, F.F.A. Hollander, S.A. de Vries and E. Vlieg, Phys. Rev. Lett. (2003) accepted.
[3] S.A. de Vries, P. Goedtkindt, S.L. Bennett, W.J. Huisman, M.J. Zwanenburg, D.-M. Smilgies, J.J. De Yoreo, W.J.P. van Enckevort, P. Bennema and E. Vlieg, Phys. Rev. Lett. 80, 2229-2232 (1998).
[4] W.J. Huisman, J.F. Peters, M.J. Zwanenburg, S.A. de Vries, T.E. Derry, D.L. Abernathy and J.F. van der Veen, Nature 390, 379-381 (1997).
Authors
E. Vlieg, M.F. Reedijk.
Dept. of Solid State Chemistry, University of Nijmegen (The Netherlands)


