- Home
- Users & Science
- Scientific Documentation
- ESRF Highlights
- ESRF Highlights 2003
- Surface and Interface Science
- Following the Corrosion of a Cu3Au Alloy Crystal
Following the Corrosion of a Cu3Au Alloy Crystal
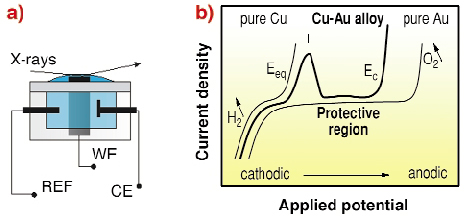
In our humid atmosphere, most corrosion processes are electrochemical in nature, driven by contact potentials e.g. formed between dissimilar metals. For the basic understanding of corrosion and its prevention, high-resolution in situ structural methods capable of atomic resolution such as scanning probe or X-ray techniques are necessary. To this aim, we conducted Grazing- incidence X-ray Diffraction (GID) experiments at the beamline ID32 on the potential controlled corrosion of Cu3Au in sulphuric acid in a thin layer in situ X-ray cell shown in Figure 102a [1].
The prototypical binary alloy Cu3Au exhibits in its ordered phase a cubic, fcc-like lattice with Cu atoms occupying the face centred sites. The Cu-Au alloy in diluted sulphuric acid shows the following behaviour upon changing the electrode potential (Figure 102b): at potentials negative of the equilibrium potential of Cu, there is no current flowing, and the alloy is stable. When the applied potential is increased, reaching the Cu equilibrium potential Eeq, current flows by dissolution of Cu ions, which is in this case the less noble metal. However the current flow slows down, unless a critical potential Ec is reached and the current, which is assigned to further Cu dissolution, rises quickly [2]. To date, detailed information available about the structural and compositional changes of the surface during this process is incomplete.
 |
|
Fig. 102: a) Scheme of the electrochemical In situ X-ray cell with three electrodes; b) a voltamogram showing schematically the dealloying of Cu3Au. Increasing the potential from cathodic (negative) to anodic (positive), a first peak in current (I) is assigned to Cu dissolution. With a further increase in potential, the current stops until a critical potential Ec, is reached. |
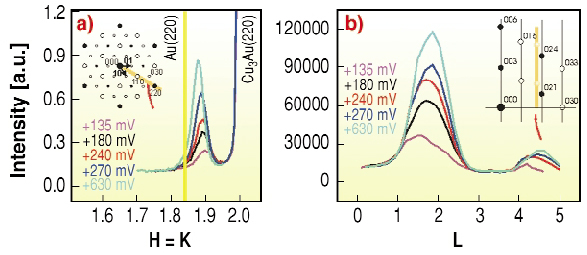
We use a hexagonal surface unit cell for the Cu3Au, in which case the reciprocal l-direction is normal to the surface. The reciprocal lattice is shown in the inset of Figures 102a and 102b. The X-ray cell with the mounted Cu3Au(111) crystal was filled with deaerated 0.1m H2SO4 solution under a controlled cathodic potential close to hydrogen evolution. At this stage we could only observe the Cu3Au Bragg reflections, indicating an unaltered surface structure. After increasing the potential, however, a new peak was observed with a lattice constant in between the values expected for pure Au and Cu3Au, which is understood by a layer of Au, which is epitaxially strained and/or alloyed Cu atoms. The new layer is aligned with the Cu3Au substrate, but with a different stacking sequence compared to the fcc-like substrate, ACB instead of ABC.
By further increasing the potential in a stepwise manner we can follow the growth of this new layer, as shown in Figure 103. The intensity in the in-plane peak (Figure 103a) as well as in the l-scans (Figure 103b) increases, while the full-width height-maximum (FWHM) of the in-plane peaks decreases, indicating the lateral growth of islands. Meanwhile the FWHM of the l-scans stays nearly constant. From the FWHM ~ 1 for this forming layer, a constant thickness of about three monolayers can be estimated. This means, islands of constant thickness grow laterally and eventually cover the whole surface as a protective layer.
 |
|
Fig. 103: a) In-plane scans along the h = k direction b) l is the l-scan on the peak in (a). The l-scans show that mainly the intensity of the peak grows, while the FWHM of these l-scans is nearly constant; l = 3 is the Bragg peak position for the layer-to-layer distance. |
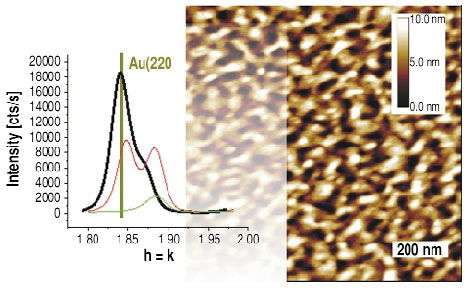
If we further increase the potential to values closer to the critical potential Ec we can observe the formation of thicker islands, as evidenced by a much smaller FWHM in the l-scan. The peak positions (in-plane and specular) now agree exactly with the lattice constant of bulk Au. The width along the surface normal is now much smaller than before, i.e., we witness the formation of thicker gold islands. Thus, a passivating layer of a gold-rich alloy and a uniform thickness of only three monolayers initially protects the alloy until thicker gold islands are formed (Figure 104) and the intermediate, passivating layer disappears.
 |
|
Fig. 104: Typical ex situ AFM image of a Cu3Au(111) surface treatment in the electrochemical cell close to the critical potential. GID shows, except for the Cu3Au substrate peaks, only peaks characteristic of the lattice constant of gold (black line). |
References
[1] see e.g. J. Zegenhagen, A. Kazimirov, G. Scherb, D.M. Kolb, D.-M. Smilgies, R. Feidenhans'l, Surf.Sci. 352-354, 346 (1996).
[2] M. Stratmann, M. Rohwerder, Nature 410, 420 (2001); H.W. Pickering, C. Wagner, J.Electrochem.Soc. 114, 698 (1967); H. Gerischer, H. Rickert, Zeitschrift für Metallkunde 46, 681 (1955).
Principal Publication and Authors
F. Renner (a), A. Stierle (b), T.L. Lee (a), S. Warren (a), B.C.C. Cowie (a), D.-M. Kolb (c), H. Dosch (b), J. Zegenhagen (a), to be published.
(a) ESRF
(b) MPI für Metallforschung, Stuttgart (Germany)
(c) Universität Ulm (Germany)


