- Home
- Users & Science
- Scientific Documentation
- ESRF Highlights
- ESRF Highlights 2013
- Dynamics and extreme conditions
- The Earth’s centre is 1000 degrees hotter than previously thought
The Earth’s centre is 1000 degrees hotter than previously thought
The interior of the Earth constitutes an enormous engine whose operation relies on the available heat. This heat is constrained by the temperature profile inside the Earth. We have determined the temperature near the Earth’s centre to be 5500 K, 1000 degrees hotter than in a previous experiment run 20 years ago.
The interior of the Earth can be divided into the crust, the mantle and the core. The core is further divided into an external portion made of liquid iron, alloyed with lighter elements, while the inner part - the inner core - is solid due to the intense pressure. Analysis of earthquake-triggered seismic waves passing through the Earth, tells us the thickness of the Earth’s layers, and even how the pressure increases with depth. However, these waves do not provide information on temperature. The temperature in the core has an important influence on the movement of material within the liquid core, creating the Earth’s magnetic field, and the solid mantle above [1], underpinning geophysical models that explain the creation of hot-spot volcanoes like the Hawaiian Islands or La Réunion.
At the border between liquid outer core and solid inner core, at 330 GPa (3.3 million atmospheres), the temperature is close to the melting temperature of iron. The melting curve of iron under extreme pressure thus allows a determination of the temperature in the Earth’s core.
 |
|
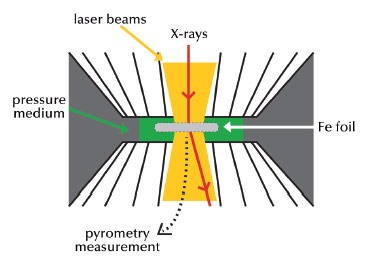
Fig. 25: Principle of the experiment. The sample is compressed in a diamond anvil cell and laser heated. Monochromatic X-ray diffraction is used to detect the phase of iron. |
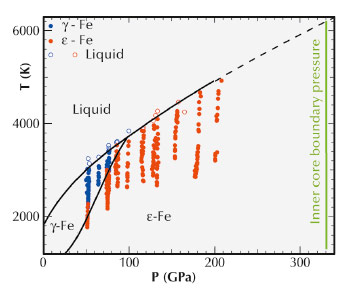
Speck-sized samples of iron have been compressed to pressures reaching several million atmospheres using a diamond anvil cell (Figure 25). Powerful laser beams were used to heat the samples up to around 5000 K. At the same time, the sample was probed by X-ray diffraction at beamline ID27 to determine whether it was solid or liquid. This was done on a second timescale, sufficiently short to keep pressure and temperature constant in the sample. We have measured melting of iron to 5100 K and 2.2 million atmospheres pressure, and then used an extrapolation method to determine the melting temperature of pure iron at a pressure equivalent to that of the border between the liquid and solid core, finding a temperature of 6230 +/- 500 K (Figure 26). This extrapolated value could change slightly if iron undergoes an unknown phase transition between the measured and the extrapolated values. Taking into account a depression of the liquidus due to the presence of light elements in the core, estimated to be 700 K ± 200 K [2], our measurements yield a temperature around 5500 K at the inner core boundary.
 |
|
Fig. 26: High pressure-high temperature (P-T) phase diagram of iron. The pressure-temperature conditions at which X-ray diffraction patterns have been collected are indicated by symbols. The phase boundaries between γ-Fe, ε-Fe and liquid Fe are based on these measurements. |
Fast X-ray diffraction observations made in this work also allows an explanation for the underestimation of the melting temperature in earlier studies [3]. Several hundreds of degrees below melting, recrystallisation effects appear in iron samples, leading to dynamic changes of the solid iron’s texture. The experiment twenty years ago used an optical technique to determine whether the samples were solid or molten, and it was probably the observation of recrystallisation at the surface that was interpreted as melting.
Principal publication and authors
S. Anzellini (a), A. Dewaele (a), M. Mezouar (b), P. Loubeyre (a) and G. Morard (c), Science 340, 464-466 (2013).
(a) Commissariat à l’Énergie Atomique, Direction des Applications Militaires Île de France Arpajon (France)
(b) ESRF
(c) Institut de Minéralogie et de Physique des Milieux Condensés, Université Pierre et Marie Curie, Paris (France)
References
[1] T. Lay, J. Hernlund and B.A. Buffett, Nat. Geosci. 1, 25-32 (2008).
[2] D. Alfè, M.J. Gillan and G.D. Price, Contemp. Phys. 48, 63-80 (2007).
[3] R. Boehler, Nature 363, 534-536 (1993).


