- Home
- News
- Spotlight on Science
- X-ray beam transverse...
X-ray beam transverse coherence analysis using near-field scattering
26-01-2010
A new method to map the two-dimensional transverse coherence function of an undulator X-ray beam is proposed. It is based on near-field speckles generated by the interference between perfectly spherical scattered waves from a colloidal suspension and the partially coherent transmitted beam.
Share
The transverse coherence of an X-ray beam is of crucial importance for many interference-based techniques such as holography, XPCS and phase contrast imaging. Knowledge of this property is a necessity for an appropriate planning of the experiment and data reduction. The quantitative characterisation of the transverse coherence at two points is usually performed through specially fabricated optical elements, like the classical Young’s double slit arrangement or simpler diffraction from single apertures or obstructions [1-2].
A joint group of researchers from the University of Milan, ESRF and DESY has developed a new technique for the characterisation of the two-dimensional transverse coherence by exploiting the speckle fields generated by near field scattering from a colloidal suspension of silica particles. These near-field speckles are formed by the interference between the scattered waves and the partially coherent transmitted beam. After Fourier transform and proper normalisation, the visibility of the fringes in this self-reference scheme provides the same information as the traditional Young’s double slit experiment for a continuous variation of pinhole distances. The statistical nature of the speckle method permits the coherence of the radiation produced by an undulator source to be obtained with high precision.
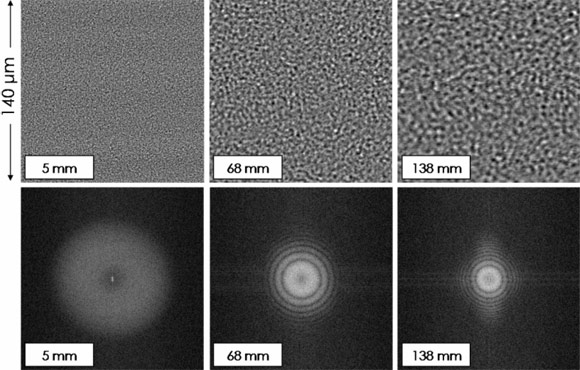
This technique has been tested at the ESRF’s high brilliance undulator beamline ID02. The beam was focused by a toroidal mirror with 5/3 demagnification of the source. The focused beam illuminated a dilute sample of Brownian particles (colloidal silica of 450 nm in diameter) and the speckle pattern was recorded at a distance z from the sample (5 mm < z < 250 mm) by a FReLoN CCD camera coupled to a microscope objective of magnification 50 with a high resolution conversion phosphor. In a narrow angular region in the forward direction, the waves scattered by the particles can be well approximated as spherical. The superposition of these waves and the strong transmitted beam leads to a staggering number of circular interference fringes resulting in a speckle intensity distribution, manifested as intensity fluctuations on a high static background. The background can be easily eliminated in the data reduction scheme. The power spectrum of the fluctuating part of the signal was numerically evaluated [3]. The fluctuating part of the signal and its power spectrum for different z are shown in Figure 1.
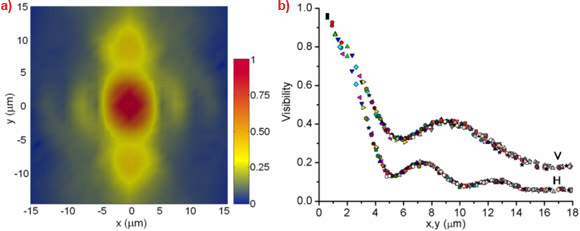
The power spectra are characterised by circular patterns that correspond to the circular interference fringes in real space. Moreover, the visibility of the patterns in the power spectrum yields the squared modulus of the complex coherence factor, C(r) = |μ(r)|2, provided that a proper change of variables is introduced to relate the measuring distance z and the scattering angle to the transverse displacement, r. As fully developed near-field speckle patterns satisfy circular Gaussian statistics, the optical aberrations do not modify the speckle size [4]. Therefore, the coherence factor at the source position can be determined by means of the imaging focusing scheme.
Figure 2a presents the two-dimensional modulus of the complex coherence factor as a function of transverse displacement (r). Figure 2b depicts the vertical and horizontal sections of the two-dimensional distribution. In the horizontal direction, the results are in accordance with the expected behaviour for a thermal source, angularly limited by the primary slits, determining the size of the coherence area (5 μm at the first minimum of the diffraction pattern). More interestingly, the beam is almost coherent over the entire vertical source dimension which is in agreement with predictions by an idealised model calculation for an undulator at resonance with minimal betatron function at its centre [5].
This technique may become useful for routine monitoring of the coherence properties of synchrotron beams as well as for the shot-by-shot analysis of free-electron laser beams.
References
[1] B.J. Thompson and E. Wolf, J. Opt. Soc. Am. 47, 895 (1957).
[2] A. Snigirev et al., Rev. Sci. Instrum. 66, 5486 (1995).
[3] R. Cerbino et al., Nature Phys, 4, 238 (2008).
[4] J.W. Goodman, in Laser Speckle and Related Phenomena, edited by J.D. Dainty, Springer-Verlag, Berlin, (1975).
[5] G. Geloni et al., Nucl. Instrum. Methods Phys. Res. Sect. A 588, 463 (2008).
Principal publication and authors
M.D. Alaimo (a,b), M.A.C. Potenza (a), M. Manfredda (a), G. Geloni (c), M. Sztucki (b), T. Narayanan (b) and M. Giglio (a), Probing the transverse coherence of an undulator X-ray beam using Brownian particles, Phys. Rev. Lett. 103, 194805 (2009).
(a) Università di Milano, Milan (Italy)
(b) ESRF
(c) DESY, Hamburg (Germany)
Top image: Transverse coherence of an undulator X-ray beam.


