Rat Tail Positions
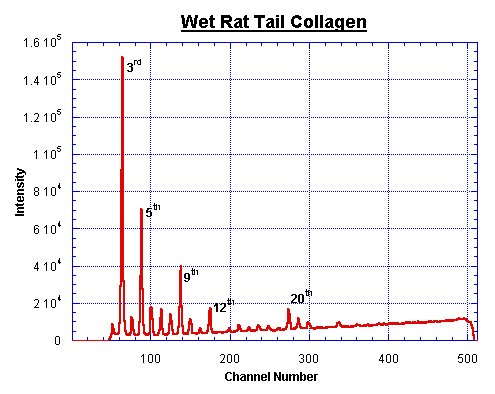
Collagen is often used as a spatial calibration sample in SAXS experiments. The SAXS pattern shows equidistant peaks with a primary spacing of around 670 Å.
A line that in many publications can be found is: ‘a lightly stretched collagen sample was used for detector calibration’. However, no one ever quantifies the term ‘lightly stretched’.
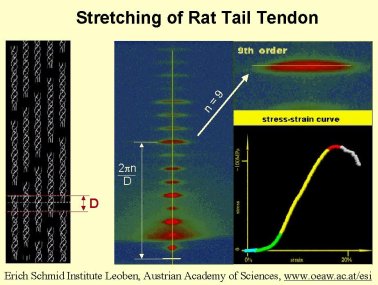
Our collegue Peter Fratzl and his coworkers have performed time-resolved tensile test experiments on collagen. In the accompanying movie one can see the tensile curve as well as the changes in the diffraction pattern that occur. The strain on the collagen is slowly increased up to the breaking point. So if any joggers who have ever experienced a torn Achilles tendon wonder how the diffraction pattern of their tendon looked just before breaking they should watch the little movie.
(.AVI size 4.6 MB)
This movie is provided through the courtesy of P. Fratzl
Literature
- P. Fratzl, K. Misof, I. Zizak, G. Rapp, H. Amenitsch and S. Bernstorff, Fibrillar structure and mechanical properties of collagen, Journal of Structural Biology 122 (1998), no. 1-2, 119-122.
- R. Puxkandl, I. Zizak, O. Paris, J. Keckes, W. Tesch, S. Bernstorff, P. Purslow and P. Fratzl, Viscoelastic properties of collagen: synchrotron radiation investigations and structural model, Philosophical Transactions of the Royal Society of London Series B-Biological Sciences 357 (2002), no. 1418, 191-197.
Most calibrations for the q-axis of SAXS data are based upon comparisons with the diffraction orders of wet rat tail collagen. Several experimenters determined the unit cell size of this molecule. The following values are extracted from publications dealing with this unit cell size.
(Compilation by Tim Wess, University of Stirling)
| d=676.08 Å | Fraser and Mac Rae,Int.J.Biol.Macromol., 3, 1981, 193-200 |
| d=670 Å unstretched d=684 Å (36Nm-2) |
Folkhard et al., J.Mol.Biol., 193, 1987, 405-407 |
| d = 675 Å | Kaseburg and Shurman, Biochim. Biophys. Acta, 11, 1953, 1-6 |
| d = 671 Å | Tomlin and Worthington, Proc. Royal Soc., London , A215, 1956, 189 |
| d = 680 Å | Bear, Am. Chem. Soc. , 66 , 1944, 1297-1305 |
| d = 668± 2 Å | Doyle et al., Proc. Royal Soc., London , B186, 1974, 67-74 |
This is not an exhaustive list. A fairly trustworthy value for the wet rattail is 670 Å. The final error margin of the q-axis, calibrated with a wet rat-tail, lies at about 3%.
Dry rat tail, as well as collagen from skin, cartilage, submucosa and ligaments, have a shorter period of approximately 650-660 Å.
Rat Tail Peaks

|
|
|||||||||||||||||||||||||||||||||||||||||||||||||||||||||||||||||||||||||||||||||||||||||||||||||||||||||||||||||||||||||||||||||||||||||||||||||||||||||||||||||||||||||||||||||||||||||||||||||||


