- Home
- Users & Science
- Scientific Documentation
- ESRF Highlights
- ESRF Highlights 2004
- X-ray Imaging
- Human Breast Tissue Characterisation with Small-angle X-ray Scattering
Human Breast Tissue Characterisation with Small-angle X-ray Scattering
Each tissue in the breast has its own small-angle scattering (SAXS) pattern, which is directly related to the molecular structure. In particular, SAXS is an excellent tool for studying the supramolecular arrangement of the collagen fibrils. Collagen is the main component of the connective tissue. It is present in the tumoural masses of the breast. Formation of collagen (fibrosis) accompanies the development of breast tumours, either benign or malignant. The supramolecular arrangement of collagen fibrils degrades upon cancer invasion, and it can be revealed by SAXS [1]. Scattering characterisation of the tissues and their pathologies is therefore possible [2].
The scattering experiments were carried out at ID02, the High-brilliance Beamline. The 1 mm thick samples were formalin fixed and sealed between thin foils. Mesh scans were performed across the samples, and scattering patterns were acquired point-by-point. A monochromatic (12 keV) pencil-beam of 0.2 x 0.2 mm and a 2D detector system were used: a fluoresce screen optically coupled to a FReLoN CCD, situated at 10 and 3 metres from the sample. The scattering patterns were angularly integrated to yield one-dimensional intensity curves. After the experiment, the samples were prepared for histological examination.
For every sample, the grid of measurement points was oriented and overlaid on the histology image. Adipose tissue (fat) showed low intensity, featureless scattering pattern (see Figure 148). Scattering from invaded fat had higher intensity and some features corresponding to the presence of newly formed collagen, as observed from the histology. The healthy collagen presented the characteristic collagen peaks (related to the axial period of the fibrils) and the structure and shape peaks, which correspond to the packing and diameter of the fibrils, respectively. The SAXS pattern from the invaded collagen, where cancer cells spread along the fibrils, had higher intensity between the peaks, and the fibrils had diameters and packing distances similar to those in the invaded fat, i.e. the fibrils were smaller in diameter and closer to each other. Furthermore, the collagen peaks were shifted to smaller angles, meaning that the axial period was longer. Finally, from the necrotic areas (i.e. dead tissues) scattering had a very high intensity, compared to that from other tissues, and it is rather featureless.
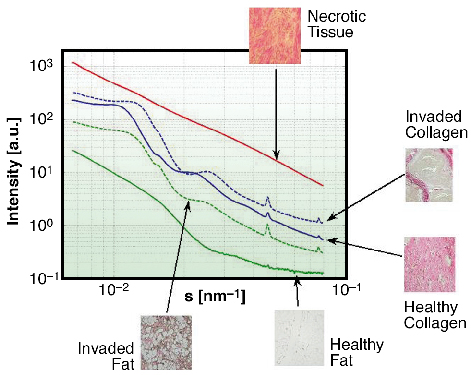 |
Fig. 148: Scattering patterns and histology of different breast tissues. |
The differences of the scattering pattern from collagen fibrils indicate that they degrade due to cancer invasion. In invaded tissues, the fibrils appear to have smaller diameter, and they pack closer, together with the lengthening of the axial period, caused by a relaxation and reordering of the intermolecular bonds. The general intensity increase is regarded as the effect of a higher superficial area of the fibrils, compatible with a "peel-off" of the fibril's molecules due to the degradation.
Using the scattering signal, maps of the structural parameters of collagen can be built and then compared with the histology. Some parameters of the scattering that indicate structural changes of the tissues and the collagen were selected, and a coloured dot was assigned to every measurement point. The intensity between the peaks and the axial period of the collagen fibrils were used to plot colour maps, which give the variation of the structural parameters. Figure 149 shows the superposition of the histology of one of the samples (a ductal carcinoma) and a map of the scattered intensity. The histology was stained in such way that collagen appear pink, fat white and cancer cells brownish. The intensity colour code was selected to be red for the higher intensity and blue for the lower. It is very clear from the Figure 149 that the scattering intensity correlates one-to-one with the histology. For instance the blue dots (low scattering intensity) correspond to the fatty tissue (white in the histology). The median intensity dots correspond to the areas of healthy collagen, whereas the dots of higher intensity are found to be in those areas that are invaded by cancer cells.
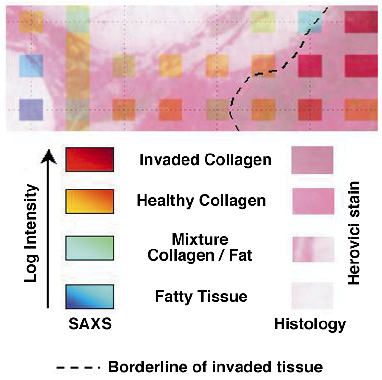 |
Fig. 149: Ductal Carcinoma. Correlation of the scattered intensity map and the histology. |
The scattering signal not only carries information about the composition of the sample, but also about the pathology of the tissues. In other words, it can help to determine whether cancer cells have invaded the tissue. Therefore, this method has the potential of being developed as a diagnostic tool.
References
[1] M. Fernández, J. Keyriläinen, R. Serimaa, M. Torkkeli, M-L. Karjalainen-Lindsberg, M. Tenhunen, W. Thomlinson, V. Urban and P. Suortti. Phys. Med. Biol., 47, 577-592 (2002).
[2] M. Fernández, J. Keyriläinen, M.-L. Karjalainen-Lindsberg, M. Leidenius, K. von Smitten, S. Fiedler and P. Suortti. Spectroscopy, 18, 167-176 (2004).
Principal Publication and Authors
M. Fernández (a,b), J. Keyriläinen (b,c), M-L Karjalainen-Lindsberg (c), M. Leidenius(c), K. von Smitten (c), T. Weiss (a), S. Fiedler (d), A. Bravin (a) and P. Suortti (a,b).
(a) ESRF
(b) University of Helsinki (Finland)
(c) Helsinki University Central Hospital (Finland)
(d) EMBL-Hamburg (Germany)
partners


European Synchrotron Radiation Facility - 71, avenue des Martyrs, CS 40220, 38043 Grenoble Cedex 9, France.