- Home
- Users & Science
- Scientific Documentation
- ESRF Highlights
- ESRF Highlights 2010
- Electronic structure and magnetism
- Hydration structure of the Cf(III) aqua ion
Hydration structure of the Cf(III) aqua ion
Properties of actinide cations in aqueous solutions have been of fundamental interest since the beginning of the nuclear technologies. The primary feature of actinide ions in water is the aqua ion structure, [An(H2O)n]m+, since it is intimately linked to complexation and transfer processes. The rareness and hazardousness nature of the heavier actinide elements has prevented a complete examination of the trend along the series [1]. Therefore, the expected actinide contraction of their aqua ions reflected in the shortening of the first water sphere and concomitant decreasing of the total first coordination number (CN) along the series is not fully confirmed. Due to the position of Cf(III), an accurate enough description of its aqua ion may certainly shed light on this fundamental question. This work presents an alternative way of study for this extreme case, by coupling new highly refined EXAFS data obtained at the BM20/ROBL beamline with the first Monte Carlo simulations of Cf(III) in water.
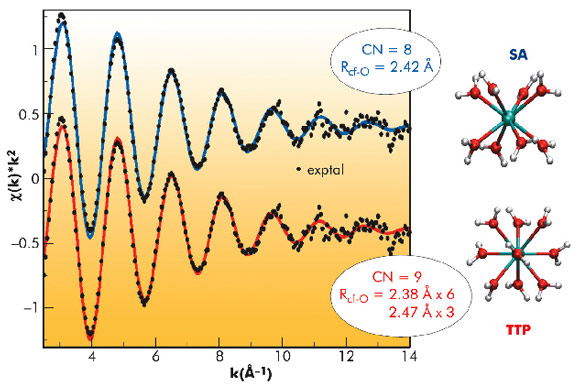
A 2 mM solution of 249Cf in perchloric acid was prepared. Figure 83 shows the experimental and fitted k2-weighted Cf LIII-edge EXAFS spectra, using two model structures for the aqua ion: the square antiprism configuration (SA), which represents an octahydrate and the trigonal tricapped prism (TTP), which implies an ennea-hydrate. Since no experimental estimation of the global amplitude factor So2 could be obtained for the Cf case, coordination numbers were fixed to the model values of 8 (SA) fitted at 2.41 Å (σ2 = 0.0077 Å2) and 9 (i.e. 6+3, TTP), fitted at 2.38 Å (σ2 = 0.0068 Å2) and at 2.47 Å (σ2 = 0.0039 Å2). The weighted averages of the Cf-O distances are comparable and there is no clear visible difference between the two fitted curves. Therefore, distinction between a TTP and an SA structure for the aqua ion cannot be unambiguously deduced from the fittings performed.
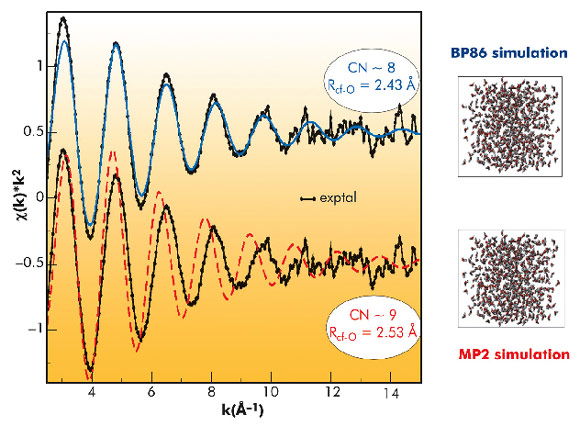
Computer simulations of Cf(III) in water represent a completely independent approach to this system. Ab initio based Cf-H2O intermolecular potentials (IP) have been developed. Two different quantum-mechanical (QM) potential energy surfaces were employed, one based on the MP2 method and the other on the DFT method (BP86 functional) [2]. Monte Carlo (NVT) simulations of a system formed by 1 Cf(III) and 500 water molecules were carried out. 2Giga configurations were generated for analysis. The MC simulation using the BP86-based IP leads to an average CN for the first hydration shell close to 8, and the first maximum of the Cf-O RDF appears at 2.43 Å, whereas the MC simulation that uses the MP2-based IP gives a CN close to 9 with the maximum for the Cf-O RDF at 2.53 Å. The absence of experimental data other than the EXAFS spectrum precludes the adoption of a convincing criterium to clearly select an IP.
 |
|
Fig. 83: Experimental (black points) and fitted (SA (CN = 8) blue and TTP(CN = 9) red lines), Cf EXAFS spectrum. |
The experimental EXAFS spectrum was compared with those derived from the structural information provided by MC simulations, (Figure 84), applying a methodology already proposed for solving other delicate structural problems [3]. The agreement for the case of the BP86 simulation is remarkable, where the intensity of the signal and the in-phase behaviour is maintained up to high k values. For the MP2 case, the spectrum shows an intensity less similar to the experimental one and a progressive out-phase behaviour. Bearing in mind that the first simulated spectrum is derived from the BP86 MC simulation, where CN ~8 and RCf-O = 2.43 Å, whereas the second simulated spectrum comes from the MP2 MC simulation where CN~9 and RCf-O = 2.53 Å, we must conclude that Cf(III) aquaion must be mainly octacoordinated. Then, as far as Cf(III) is the heaviest actinide aquaion for which there is experimental information, the actinide contraction is supported by the present study
(RU-O = 2.56Å and CN = 9±1; RPu-O = 2.51Å and CN = 9±1; RCm-O = 2.47Å and CN = 9±1) [1].
 |
|
Fig. 84: Comparison of the experimental Cf EXAFS spectrum (black points) with the simulated spectra: BP86 (blue line) and MP2 (red line). |
This work illustrates the benefits which can be obtained from the combination of experimental XAS spectroscopies and computer simulations. Likewise, it traces out a scarcely explored combined methodology that could be useful for other complex chemical problems.
Principal publication and authors
E. Galbis (a), J. Hernández-Cobos (b), C. Den Auwer (c), C. Le Naour (d), D. Guillaumont (c), E. Simoni (d), R.R. Pappalardo (a) and E. Sánchez Marcos (a), Angew. Chem. Int Ed. 49, 3811 (2010).
(a) Departamento de Química Física. Universidad Sevilla (Spain)
(b) Instituto de Ciencias Físicas, UNAM, Cuernavaca (México)
(c) Radiochemistry Process Department, CEA Marcoule (France)
(d) Institut de Physique Nucleaire Orsay, Université Paris-Sud (France)
References
[1] S. Skanthakumar, M.R. Antonio, R.E. Wilson and L. Soderholm, Inorg. Chem. 46, 3485 (2007).
[2] A. Moritz, X.Y. Cao and M. Dolg, Theor.Chem Acc., 117, 473 (2007).
[3] P.J. Merkling, A. Muñoz-Páez and E. Sánchez Marcos, J. Am. Chem. Soc. 124, 10911 (2002).


